NIFTY 50 INDEX Elliott Wave Technical Analysis: 1D Chart
NIFTY 50 INDEX Technical Analysis Overview
Function: Counter Trend (Minor Degree, Grey)
Mode: Corrective
Structure: Zigzag
Position: Minute Wave ((c))
Market Outlook & Key Levels
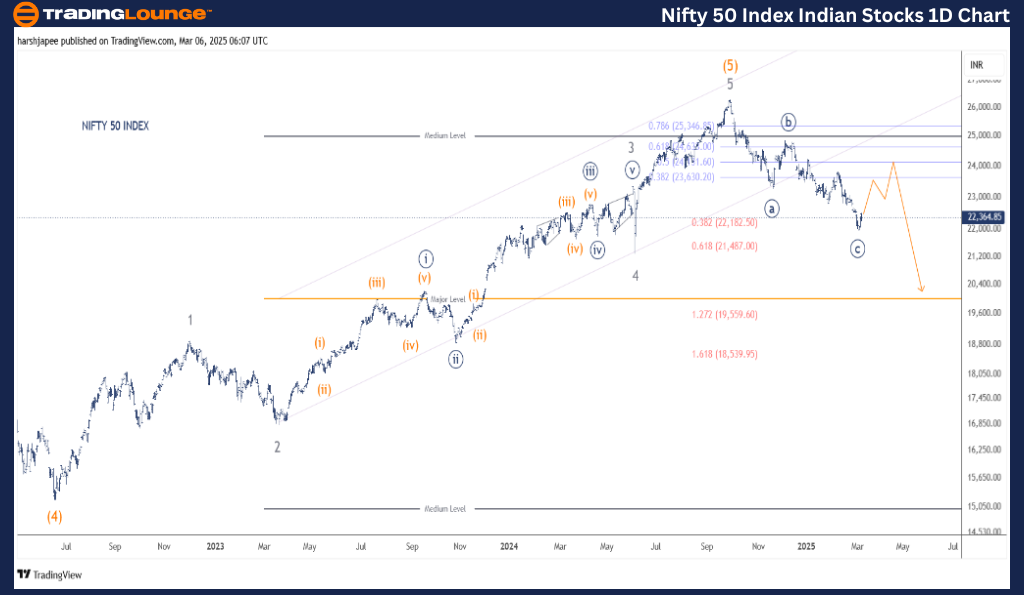
- The alternate Elliott Wave count is now the preferred scenario, indicating a completed ((a)) - ((b)) - ((c)) Zigzag pattern in the 22,000 - 21,900 zone.
- A counter-trend rally remains highly probable, potentially driving the index towards the 23,700 - 24,000 range.
- Alternatively, a continued decline could test the 21,300 - 21,400 support zone, aligning with Minor Wave 4 of the prior uptrend.
- Invalidation Point: 26,400
NIFTY 50 INDEX – Daily Chart Analysis & Elliott Wave Counts
The NIFTY 50 INDEX daily chart suggests a major top formation at 26,300 in September 2024.
Elliott Wave Count & Market Behavior
- The high-probability wave count indicates the index completed Minute Wave ((a))/((i)) at 23,267, followed by:
- Wave ((b))/((ii)) towards 24,900
- Wave ((c))/((iii)) correcting to the 22,500 - 22,550 zone before reversing downward.
- Previously, the index found support at 15,200, marking the termination of Intermediate Wave (4) Orange.
- A Minor Degree impulse wave (1-5) followed, pushing prices to 26,300, which marked the end of Wave (5).
- Short-term bullish scenario: A potential rally towards 24,000 remains in play.
- Long-term bearish scenario: A deeper correction to 15,000 could develop.
NIFTY 50 INDEX Elliott Wave Technical Analysis: 4H Chart
NIFTY 50 INDEX Technical Analysis Overview
Function: Counter Trend (Minor Degree, Grey)
Mode: Corrective
Structure: Zigzag
Position: Minute Wave ((c))
Market Outlook & Key Levels
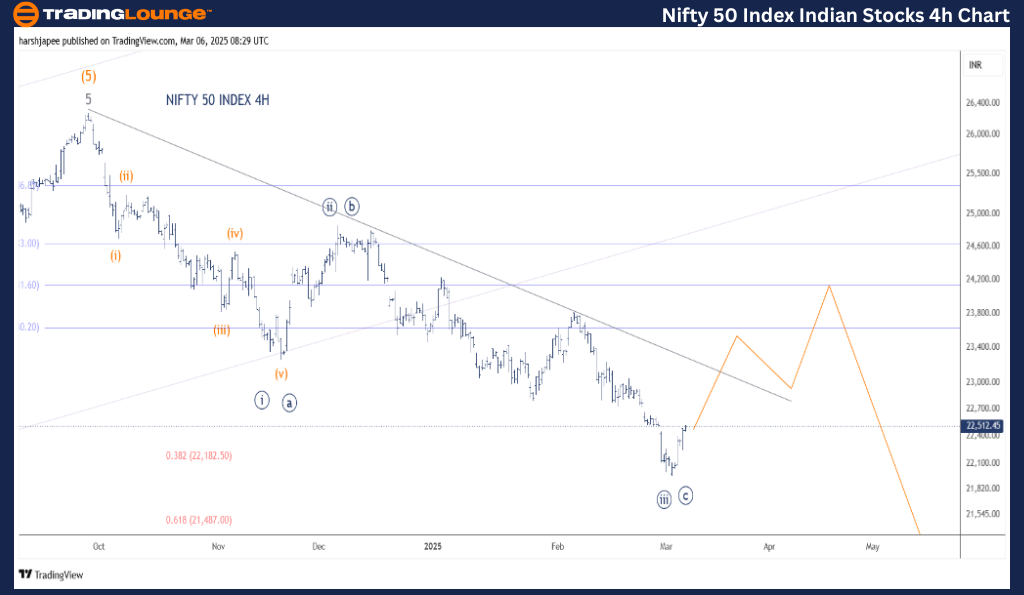
- The alternate Elliott Wave count is preferred, suggesting a completed ((a)) - ((b)) - ((c)) Zigzag pattern in the 22,000 - 21,900 zone.
- A counter-trend rally may push the index towards 23,700 - 24,000 before resuming a downward move.
- Conversely, if selling pressure persists, the index could target 21,300 - 21,400, aligning with Minor Wave 4 of the previous bullish cycle.
- Invalidation Point: 26,400
NIFTY 50 INDEX – 4H Chart Analysis & Elliott Wave Counts
The 4H chart presents sub-waves following the 26,280 - 26,300 peak on September 27, 2024.
Elliott Wave Count & Market Behavior
- The Minute Wave ((a)) - ((b)) - ((c)) Zigzag correction appears complete from the 26,280 highs.
- Alternatively, the pattern could still be in development:
- Minute Wave ((i)) - ((ii)) completion is possible, with ((iii)) still evolving.
- The initial decline to 23,257 is identified as Minute Wave ((a))/((i)), followed by Wave ((b))/((ii)) to 24,900.
- Minute Wave ((c))/((iii)) is potentially complete at 21,900 - 22,000.
- The index is trading above 22,500 at present, with a counter-trend rally targeting 24,400 - 24,500.
- A breakout above 23,830 would confirm that bullish momentum is gaining traction.
Technical Analyst: Harsh Japee
Source: visit Tradinglounge.com and learn From the Experts Join TradingLounge Here
Previous: CAC 40 (France) Elliott Wave Technical Analysis
VALUE Offer - Buy 1 Month & Get 3 Months!Click here
Access 7 Analysts Over 200 Markets Covered. Chat Room With Support
Conclusion
The NIFTY 50 INDEX is currently trending higher towards 24,000, before resuming its larger-degree downtrend.
Stay Updated with TradingLounge
📢 TradingLounge subscribers receive Daily NIFTY 50 INDEX Trade Setup Videos with Elliott Wave Counts and expert market insights.