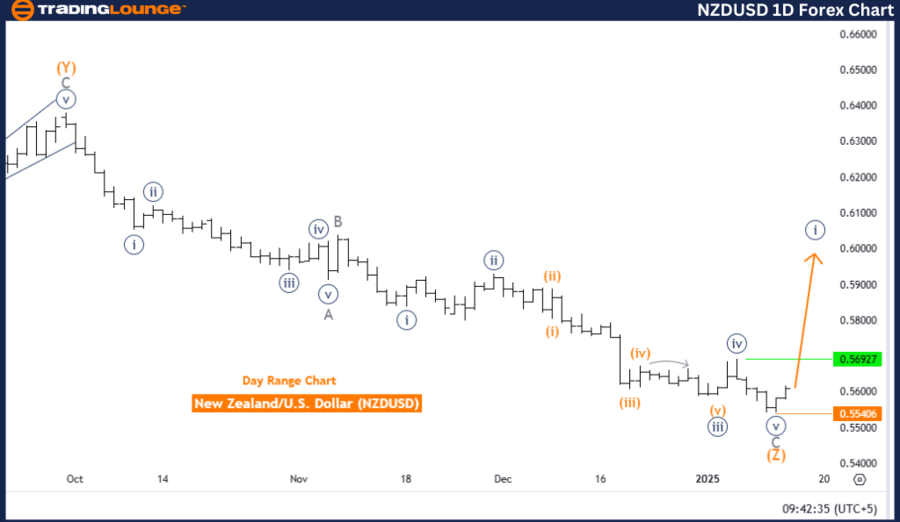
New Zealand Dollar/ U.S. Dollar (NZDUSD) Elliott Wave Analysis - Trading Lounge Day Chart
NZDUSD Elliott Wave Technical Analysis
Function: Bullish Trend
Mode: Impulsive
Structure: Navy Blue Wave 1
Position: Gray Wave 1
Direction Next Lower Degrees: Navy Blue Wave 2
Details: Navy blue wave 1 of 1 marks a new trend in progress.
Wave Cancel Invalidation Level: 0.555406
The New Zealand Dollar to US Dollar (NZDUSD) pair demonstrates a bullish trend on the daily chart, as identified through Elliott Wave analysis. The market is currently in an impulsive phase, represented by navy blue wave one, which is part of the larger gray wave one structure. This progression signals the start of a fresh upward trend, reflecting robust bullish momentum.
Key Wave Analysis
Navy Blue Wave One:
- Represents the initial impulsive wave of the emerging trend.
- Marks the transition from prior corrective action to the beginning of a bullish cycle.
Navy Blue Wave Two:
- Expected to follow navy blue wave one as a corrective phase.
- Likely to serve as a temporary pullback before the continuation of the upward movement.
Invalidation Level:
- If the price drops below 0.555406, the wave structure becomes invalid.
- This threshold is crucial for confirming the current bullish scenario, and any movement below it would require reevaluating the wave pattern and market outlook.
Summary
The NZDUSD currency pair is in the early stage of a bullish cycle, with navy blue wave one unfolding within gray wave one. This phase signals the initiation of a new upward trend with strong impulsive momentum. The progression of navy blue wave one is critical to confirming the market's bullish trajectory. As the trend matures, navy blue wave two is anticipated as a corrective phase, with 0.555406 serving as the invalidation level for the wave structure.
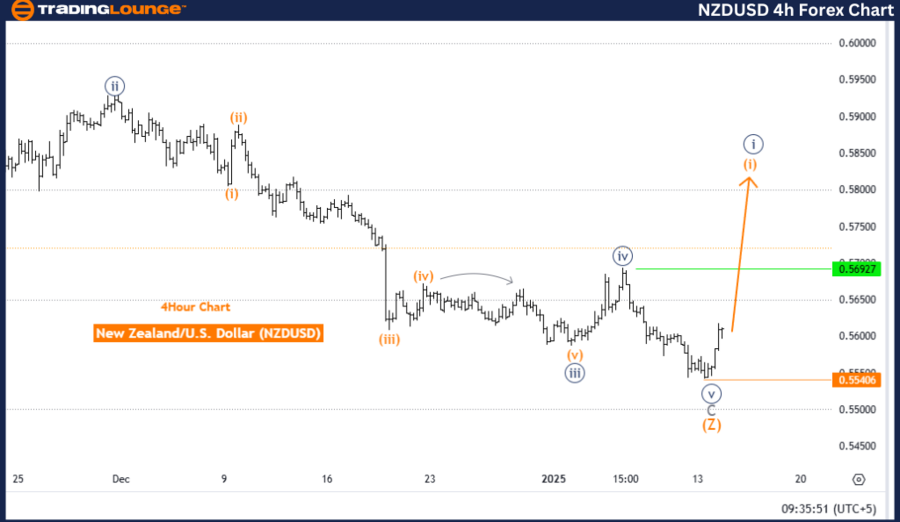
New Zealand Dollar/ U.S. Dollar (NZDUSD) Elliott Wave Analysis - Trading Lounge 4-Hour Chart
NZDUSD Elliott Wave Technical Analysis
Function: Bullish Trend
Mode: Impulsive
Structure: Orange Wave 1
Position: Navy Blue Wave 1
Direction Next Lower Degrees: Orange Wave 2
Details: Orange wave 1 of navy blue wave 1 signals a new trend in progress.
Wave Cancel Invalidation Level: 0.555406
The New Zealand Dollar to US Dollar (NZDUSD) pair displays a bullish trend on the four-hour chart, supported by Elliott Wave analysis. The current impulsive phase is defined by orange wave one, which is a component of the broader navy blue wave one structure. This development confirms the emergence of a new bullish trend, marked by increasing momentum.
Key Wave Analysis
Orange Wave One:
- Represents the first impulsive wave of the new trend.
- Reflects the market’s transition from corrective behavior to bullish momentum.
Orange Wave Two:
- Expected to act as a corrective pullback after orange wave one completes.
- This phase will likely set the stage for continued upward movement.
Invalidation Level:
- A price drop below 0.555406 invalidates the current wave structure.
- This level is essential for verifying the integrity of the ongoing Elliott Wave setup and maintaining the bullish outlook.
Summary
The NZDUSD currency pair is in the initial stages of a bullish trend, with orange wave one forming part of navy blue wave one. This phase establishes the foundation for future impulsive advances, confirming a shift into bullish momentum. The development of orange wave one is vital for the bullish case, while orange wave two is expected to act as a corrective period. The invalidation level at 0.555406 ensures the accuracy and reliability of the wave structure analysis.
Technical Analyst: Malik Awais
Source: visit Tradinglounge.com and learn From the Experts Join TradingLounge Here
Previous: AUDUSD Elliott Wave Technical Analysis
VALUE Offer - Buy 1 Month & Get 3 Months!Click here
Access 7 Analysts Over 200 Markets Covered. Chat Room With Support