The Procter & Gamble Co., Elliott Wave Technical Analysis
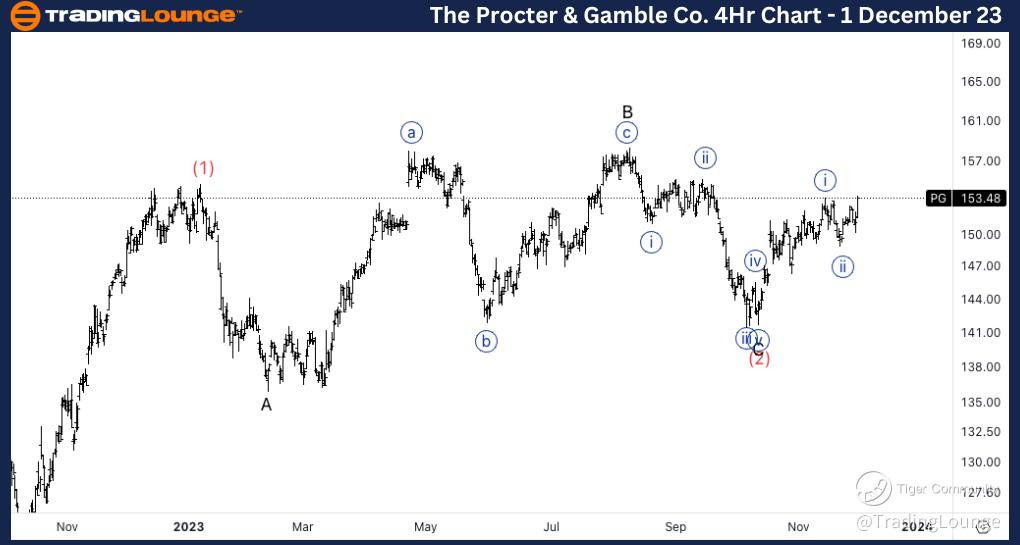
The Procter & Gamble Co., (PG:NYSE): 4h Chart 1 December 23
PG Stock Market Analysis: We are looking at the possibility of a bullish scenario, which is very similar to what is happening with the DJI. Looking for a potential correction in wave (2) to be in place to now resume higher.
PG Elliott Wave Count: Wave {i} of 1.
PG Technical Indicators: Above all averages.
PG Trading Strategy: Looking for longs into wave {iii} with 153$ as tested support.
TradingLounge Analyst: Alessio Barretta
Source: Tradinglounge.com get trial here!
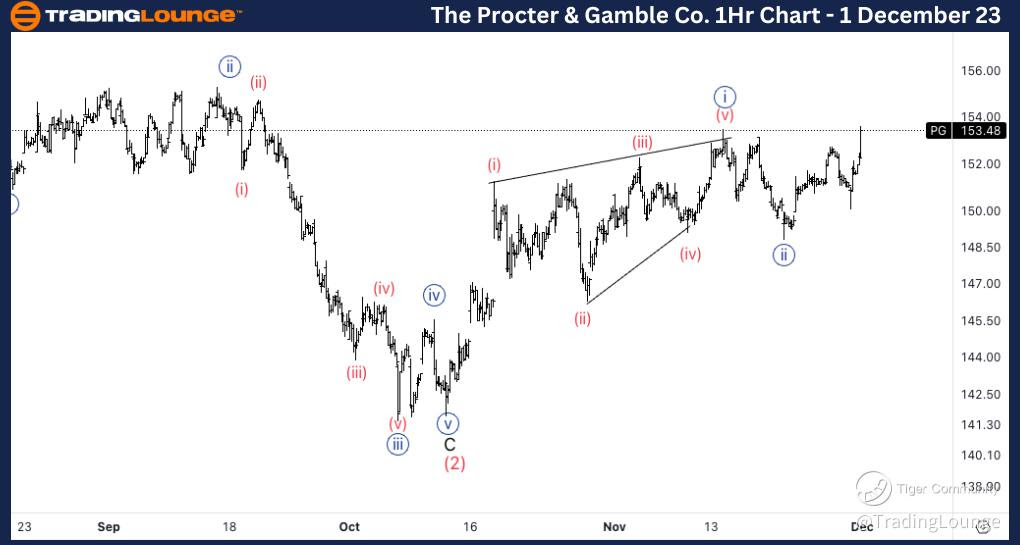
The Procter & Gamble Co., PG: 1-hour Chart 1 December 23
The Procter & Gamble Co., Elliott Wave Technical Analysis
PG Stock Market Analysis: Looking for a potential diagonal in wave {i} and a three wave move in wave {ii}. We are now looking for a potential wave (iii) of {iii} to be in place which should start an acceleration higher.
PG Elliott Wave count: Wave (iii) of {iii}.
PG Technical Indicators: Above all averages.
PG Trading Strategy: Looking for longs into wave {iii} with 153$ as tested support.