TradingLounge Commodity: Wheat Elliott Wave Analysis

Function: Trend

Mode: Trend

Structure: Impulse wave

Position: Wave A of (B)

Direction: Wave A of (B) is still in play

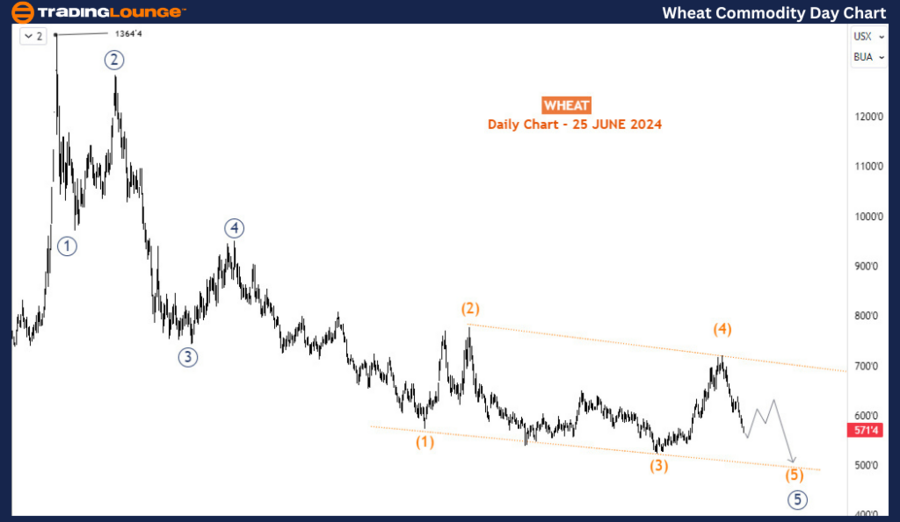
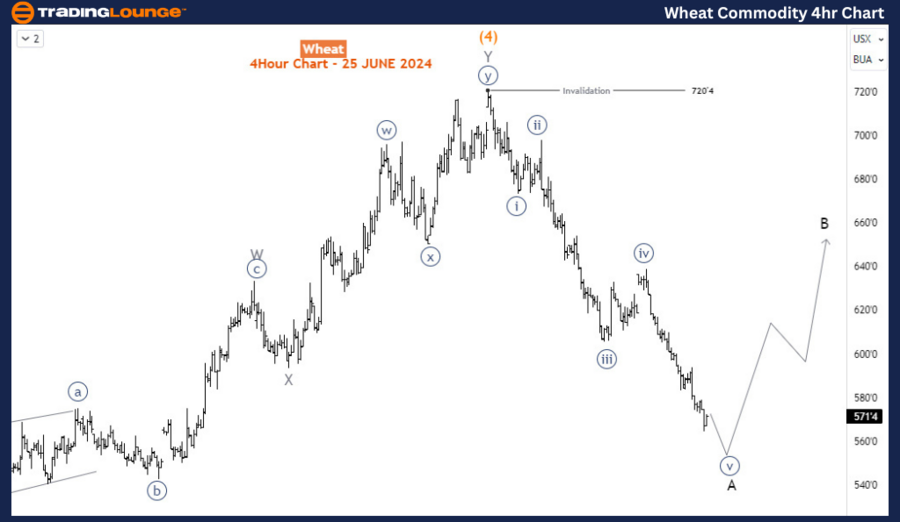
Details: Wheat daily and H4 charts have been adjusted due to the rapid and deep decline from 720’4. The long-term forecast on the daily chart shows that the surge to 720’4 is part of the impulse wave from March 2022. We are now in wave (5), expected to emerge into a 3-wave structure. The price now appears to be in wave A, after which it will correct upside for B before returning downside.

Wheat Elliott Wave Technical Analysis

Overview: Since late May, grain prices have been falling sharply, with Wheat shedding over 20% since May 28th, 2024. This decline is about to erase the gains made from mid-April to late May. The nearly one-month sell-off adds to the long-term decline from March 2022, when Wheat traded at 1364’4. Currently trading at 571’4, Wheat is likely to fall further toward 500 in the coming weeks.

Daily Chart Analysis: The decline from March 2022 is forming a bearish impulse wave structure in the primary degree. The 5th wave is completing a diagonal structure, which has been the most time-consuming among the actionary waves, lasting nearly 21 months. The price is currently in wave (5) of 5 (circled), which will likely evolve into a 3-wave structure targeting the 500 major psychological level.
Wheat-Commodity-Day-...


H4 Chart Analysis: The H4 chart shows the sub-waves of wave (5), which is now close to completing its first leg - wave A of (5). A corrective bounce is expected to follow for wave B before the price turns downside for wave C of (5) toward 500, provided the 720’4 pivot is not breached. Wheat and other grains are overwhelmingly bearish and may continue in this direction for the next several weeks before major bullish corrections begin.

Conclusion: Wheat prices remain bearish with the potential for further declines, targeting the 500 psychological level, contingent on the completion of the current corrective wave B and the subsequent wave C of (5).

Technical Analyst: Sanmi Adeagbo

Source: visit Tradinglounge.com and learn From the Experts Join TradingLounge Here 

See Previous: Coffee Elliott Wave Technical Analysis

Special Trial Offer - 0.76 Cents a Day for 3 Months! Click here

Access 7 Analysts Over 170 Markets Covered. Chat Room With Support
Wheat-Commodity-4h-C...

Related

Enhance your Cryptocurrency Trading with Polkadot Crypto Price News Today Elliott Wave Technical Analysis

Enhance your Cryptocurrency Trading with Polkadot Crypto Price News Today Elliott Wave Technical Analysis

This article provides a comprehensive Elliott Wave analysis for Polkadot (DOTUSD), including price p...

Read More >
Deere & Co. (DE) Stocks Elliott Wave Technical Analysis: Key Support Levels, Forecasts, and Technical Outlook

Deere & Co. (DE) Stocks Elliott Wave Technical Analysis: Key Support Levels, Forecasts, and Technical Outlook

This comprehensive Elliott Wave analysis of Deere & Co. (DE) offers traders valuable insights into t...

Read More >
Unlock AUDUSD's Bullish Potential: In-Depth Australian Dollar/U.S. Dollar Elliott Wave Analysis & Expert Trading Strategy

Unlock AUDUSD's Bullish Potential: In-Depth Australian Dollar/U.S. Dollar Elliott Wave Analysis & Expert Trading Strategy

Get the most recent AUDUSD Elliott Wave analysis with insights into the bullish trend and wave struc...

Read More >
Unlocking Profit Potential with Elliott Wave Analysis for Binance Coin (BNBUSD) Trading - 13th February 2024

Unlocking Profit Potential with Elliott Wave Analysis for Binance Coin (BNBUSD) Trading - 13th February 2024

The February 13, 2024, Binance Coin (BNBUSD) Elliott Wave Analysis, explores cryptocurrency market t...

Read More >
Highlights Polkadot’s Bearish Momentum and Key Market Indicators: Crypto DOTUSD Elliott Wave Technical Analysis

Highlights Polkadot’s Bearish Momentum and Key Market Indicators: Crypto DOTUSD Elliott Wave Technical Analysis

This comprehensive analysis provides a detailed look at DOTUSD (Polkadot) through Elliott Wave patte...

Read More >
Tech Stock Forecast: AAPL, NVDA, AMZN Lead While TSLA, MSFT, GOOGL Lag...

Tech Stock Forecast: AAPL, NVDA, AMZN Lead While TSLA, MSFT, GOOGL Lag...

The Elliott Wave analysis indicates an upward movement (Wave (ii) of iii)) for the SP500 and NASDAQ ...

Read More >

Buy 1 Month

Get 3 Months!

Special Offer:

Trade Recommendations

Unleash the power of deversified trading with our comprehensive portfolio, covering:

  • Stock Trades
  • Crypto Trades
  • Forex Trades
  • Commodity Trades
Elliott Wave Analysis

Gain a competive edge with expert insights in to:

  • Global Indices
  • US Stocks & ASX Stocks
  • Forex & Crypto
  • Commodities
Top-Notch Trading Tools

Equip yourself with the tools of success:

  • Social Chat
  • Elliott Wave Algorithm
  • Screener
  • TradingLevels
  • Trading Game
7 Elliott Wave Analysts

Stay ahead of the market with daily charts and insightful videos
-Your secret to strategic trading!

JOIN HERE


Welcome to TradingLounge (ASIC A.R.No. 321187), specialists in trades, trading education and technical analysis, covering stocks, indices, commodities, forex and cryptocurrencies.

When you join TradingLounge you have access to everything we offer, including trade tools, educational content and a social platform to chat with like-minded investors.

Read more

@Copyright 2024 by tradinglounge.com

Contact Us

Australian no: 02 4787 6020

International no: +61 (2) 47876020

Pay with:

Find us on