DOTUSD Elliott Wave Analysis: Polkadot Crypto Daily Chart

DOTUSD Elliott Wave Technical Analysis

Function: Counter Trend

Mode: Corrective

Structure: Flat

Position: Wave C

Direction (Next Higher Degree): Wave (II) of Impulse

Invalidation Level: Wave II equals 61.8% of Wave I at 5.225

DOTUSD Trading Strategy:

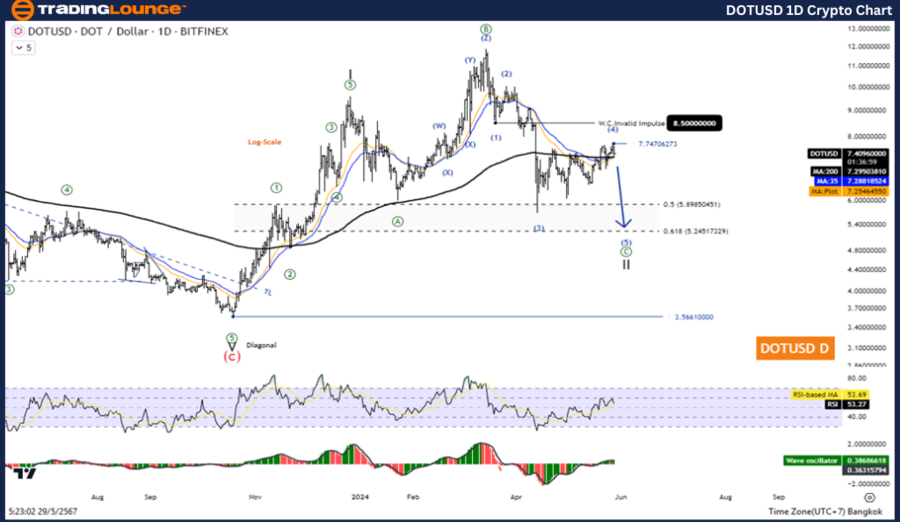
The ongoing correction in DOTUSD is approaching its final phase in Wave C. This phase is likely to test the 5.245 level before entering a new upward trend in Wave 3. Traders should wait for this correction to complete before joining the uptrend.

Polkadot Technical Indicators:

  • Moving Average (MA200): The price is above the 200-day moving average, indicating an overall uptrend.
  • Wave Oscillator: The momentum is bullish.

Daily Chart Analysis: DOTUSD

Counter Trend and Corrective Mode

The current corrective structure in DOTUSD, identified as a flat formation, is in the final phase of Wave C. According to Elliott Wave principles, this Wave C is part of a larger corrective Wave (II). The key level to watch is 5.225, which is where Wave II equals 61.8% of Wave I.

DOTUSD-1D-Crypto-Cha...


DOTUSD Elliott Wave Analysis: Polkadot Crypto H4 Chart

DOTUSD Elliott Wave Technical Analysis

Function: Follow Trend

Mode: Motive

Structure: Impulse

Position: Wave 4

Direction (Next Higher Degree): Wave C of Flat

Invalidation Level:

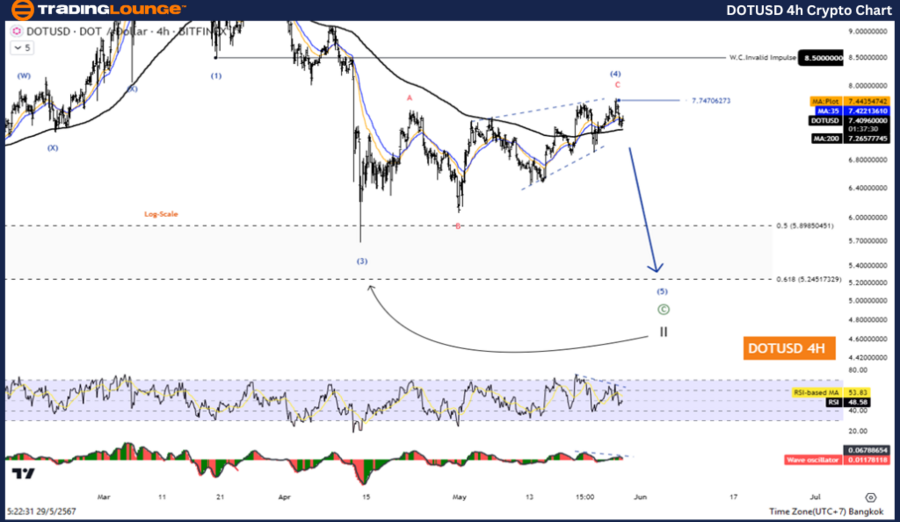
Details: A short-term pullback in Wave 4 is expected before a continuation in Wave 5.

Polkadot ​​​​​​​Trading Strategy:

DOTUSD remains in an uptrend. The correction appears to be over, and prices are rising in the fifth wave. However, a slight pullback may occur before the continuation of the uptrend. Traders should look for opportunities to join the uptrend during these pullbacks.

DOTUSD Technical Indicators:

  • Moving Average (MA200): The price is above the 200-day moving average, indicating an overall uptrend.
  • Wave Oscillator: The momentum is bullish.

H4 Chart Analysis: DOTUSD

Follow Trend and Motive Mode

On the H4 chart, DOTUSD is in a motive phase, with the current structure being an impulse wave. The price is experiencing a short-term pullback in Wave 4, which is expected before the continuation of the downtrend in Wave 5.

Technical Analyst:  Kittiampon Somboonsod

Source: visit Tradinglounge.com and learn From the Experts Join TradingLounge Here 

See Previous: Dogecoin/ U.S. Dollar (DOGEUSD) Elliott Wave Technical Analysis

Special Trial Offer - 0.76 Cents a Day for 3 Months! Click here

Access 7 Analysts Over 170 Markets Covered. Chat Room With Support

DOTUSD-4H-Crypto-Cha...

Conclusion

Elliott Wave Analysis provides a structured approach to understanding market movements. For Polkadot (DOTUSD), the daily and H4 charts indicate a bullish trend, with corrective and motive waves suggesting strategic entry points for traders. The completion of Wave C on the daily chart and the anticipated Wave 5 on the H4 chart offer potential opportunities for profit.


Related

Dell Technologies Inc. Stock: Detailed DELL Elliott Wave Technical Analysis and Future Market Trends

Dell Technologies Inc. Stock: Detailed DELL Elliott Wave Technical Analysis and Future Market Trends

This comprehensive Elliott Wave analysis for Dell Technologies (DELL) provides a detailed breakdown ...

Read More >
Comprehensive AUD/USD Elliott Wave Analysis: Daily & 4-Hour Charts Reveal Key Trends and Technical Levels for Forex Traders

Comprehensive AUD/USD Elliott Wave Analysis: Daily & 4-Hour Charts Reveal Key Trends and Technical Levels for Forex Traders

This analysis provides an in-depth look at the AUD/USD currency pair through the lens of Elliott Wav...

Read More >
Elliott Wave Natural Gas Forecast: Bullish $4.00–$4.47 Rally from $2.858 Low, Watch $4.70 Breakout Potential

Elliott Wave Natural Gas Forecast: Bullish $4.00–$4.47 Rally from $2.858 Low, Watch $4.70 Breakout Potential

Elliott Wave analysis suggests a bullish Natural Gas rally from the April 24 low of $2.858 toward $4...

Read More >
MicroStrategy Inc. (MSTR) Stocks Elliott Wave Technical Analysis: Covers Potential Trends, Trading Strategies, and Key Resistance Levels

MicroStrategy Inc. (MSTR) Stocks Elliott Wave Technical Analysis: Covers Potential Trends, Trading Strategies, and Key Resistance Levels

Discover the latest MicroStrategy (MSTR) stock analysis, including Elliott Wave forecasts, price pre...

Read More >
THETAUSD Elliott Wave Analysis: Technical Insights, Price Predictions and Key Wave Structures for Crypto Market Trends

THETAUSD Elliott Wave Analysis: Technical Insights, Price Predictions and Key Wave Structures for Crypto Market Trends

Elliott Wave analysis of THETA/USD covers short-term and long-term forecasts. Discover trading strat...

Read More >
Forex Trading: AUDUSD Elliott Wave Forecast Shows Bullish Trend with Wave Counts and Key Levels for Daily and 4-Hour Chart Traders

Forex Trading: AUDUSD Elliott Wave Forecast Shows Bullish Trend with Wave Counts and Key Levels for Daily and 4-Hour Chart Traders

This AUDUSD Elliott Wave update provides a detailed technical forecast for both daily and 4-hour cha...

Read More >

$1 for 2 Weeks

then $29 a month!

What a Special Offer!

Trade Recommendations

Unleash the power of deversified trading with our comprehensive portfolio, covering 250+ markets:

  • Stock Trades
  • Crypto Trades
  • Forex Trades
  • Commodity Trades
Elliott Wave Analysis

Gain a competitive edge with expert insights and AI-powered Elliott Wave charting into:

  • Global Indices
  • US Stocks & ASX Stocks
  • Forex & Crypto
  • Commodities
Top-Notch Trading Tools

Equip yourself with the tools of success:

  • Real-time Chat rooms
  • Elliott Wave Algorithm
  • Portfolio tools
  • TradingLevels
  • Screener
  • Trading Game
7 Elliott Wave Analysts

Stay ahead of the market with daily charts and insightful videos
Your secret to strategic trading!

JOIN HERE


Welcome to TradingLounge (ASIC A.R.No. 321187), specialists in trades, trading education and technical analysis, covering stocks, indices, commodities, forex and cryptocurrencies.

When you join TradingLounge you have access to everything we offer, including trade tools, educational content and a social platform to chat with like-minded investors.

Read more

@Copyright 2024 by tradinglounge.com

Contact Us

Australian no: 02 4787 6020

International no: +61 (2) 47876020

Pay with:

Find us on