28May

Dogecoin Crypto Price News Today Elliott Wave Technical Analysis: Indicates a Bullish trend on both daily and 4-hour charts

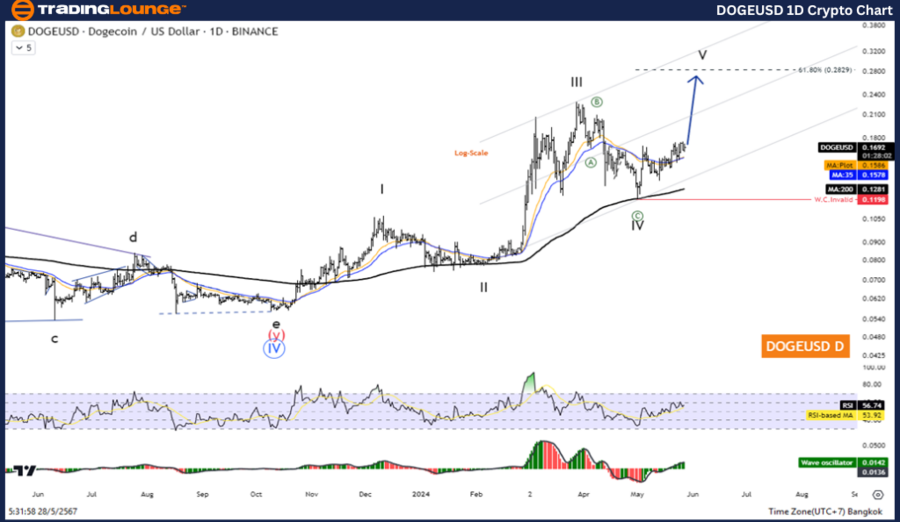
DOGEUSD Elliott Wave Analysis TradingLounge Daily Chart,

Dogecoin/ U.S. Dollar (DOGEUSD)

DOGEUSD Elliott Wave Technical Analysis

Function: Counter Trend

Mode: Corrective

Structure: Zigzag

Position: Wave ((C))

Direction Next Higher Degrees: Wave IV of Impulse

Wave Cancel Invalid Level:

Details: Wave IV may be complete, and the price is increasing again in Wave V.

Dogecoin/ U.S. Dollar (DOGEUSD) Trading Strategy:

Overall, Dogecoin remains in an uptrend. It appears that the correction is over, and prices are rising again in the fifth wave. However, there may be a slight pullback before continuing to increase. Look for opportunities to join the uptrend.

Dogecoin/ U.S. Dollar (DOGEUSD) Technical Indicators:

  • The price is above the MA200, indicating an uptrend.
  • The Wave Oscillator shows bullish momentum.

Dogecoin's performance against the U.S. Dollar has been analyzed using the Elliott Wave theory, which shows the market's potential moves based on crowd psychology. Currently, the analysis suggests we are in a counter-trend corrective mode, forming a zigzag pattern. This analysis is at Wave ((C)) level, which corresponds to Wave IV of the larger impulse wave.

DOGEUSD-1D-crypto-ch...


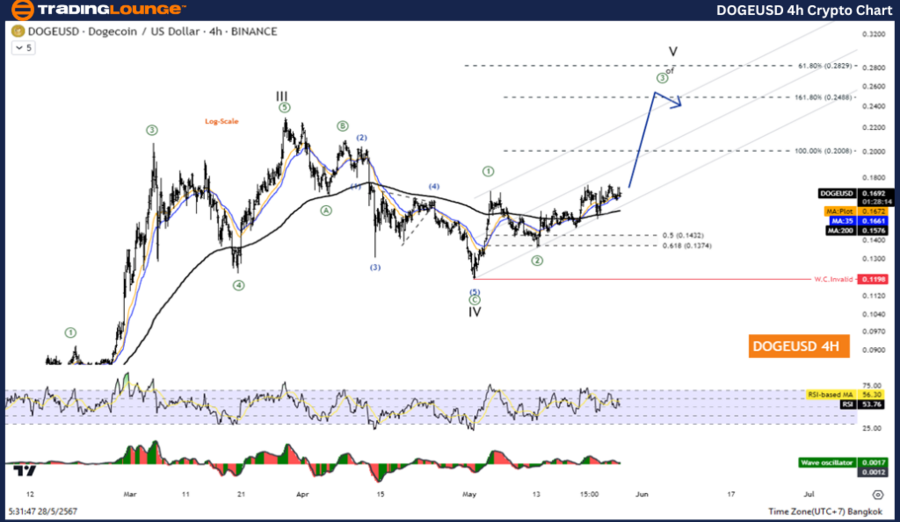
DOGEUSD Elliott Wave Analysis TradingLounge H4 Chart,

Dogecoin/ U.S. Dollar (DOGEUSD)

DOGEUSD Elliott Wave Technical Analysis

Function: Follow Trend

Mode: Motive

Structure: Impulse

Position: Wave ((3))

Direction Next Higher Degrees: Wave V of Impulse

Wave Cancel Invalid Level:

Details: Wave ((3)) is equal to 161.8% of Wave ((1)) at 0.2488.

Dogecoin/ U.S. Dollar (DOGEUSD) Trading Strategy:

Overall, Dogecoin remains in an uptrend. It appears that the correction is over, and prices are rising again in the fifth wave. However, there may be a slight pullback before continuing to increase. Look for opportunities to join the uptrend.

Dogecoin/ U.S. Dollar (DOGEUSD) Technical Indicators:

  • The price is above the MA200, indicating an uptrend.
  • The Wave Oscillator shows bullish momentum.

On the 4-hour chart, Dogecoin follows the trend in a motive wave, specifically in an impulse mode. The current position is at Wave ((3)), which is often the strongest and most extended wave in an impulse sequence. Wave ((3)) has reached 161.8% of Wave ((1)), hitting 0.2488, suggesting significant bullish momentum.

Technical Analyst:  Kittiampon Somboonsod

Source: visit Tradinglounge.com and learn From the Experts Join TradingLounge Here 

See Previous: Bitcoin/ U.S. dollar(BTCUSD) Elliott Wave Technical Analysis

Special Trial Offer - 0.76 Cents a Day for 3 Months! Click here

Access 7 Analysts Over 170 Markets Covered. Chat Room With Support

DOGEUSD-4hr-crypto-c...

Related

Elliott Wave Analysis: S&P 500, NASDAQ 100, DAX 40, FTSE 100, ASX200 Trading Strategies

Elliott Wave Analysis: S&P 500, NASDAQ 100, DAX 40, FTSE 100, ASX200 Trading Strategies

Elliott Wave Analysis indicates a 'Risk On' sentiment for ASX 200, DAX 40, and FTSE 100. The...

Read More >
Elliott Wave XLE SPDR Energy Select Sector ETF Analysis Reveals Bullish Energy ETF Forecast and Key Trading Strategy for 2025 Investors

Elliott Wave XLE SPDR Energy Select Sector ETF Analysis Reveals Bullish Energy ETF Forecast and Key Trading Strategy for 2025 Investors

This technical overview of XLE applies Elliott Wave analysis to project upcoming movements in the SP...

Read More >
New Zealand Dollar/U.S.Dollar (NZDUSD) Elliott Wave Technical Analysis 12 January 24

New Zealand Dollar/U.S.Dollar (NZDUSD) Elliott Wave Technical Analysis 12 January 24

NZDUSD Elliott Wave Analysis for the daily chart on 12 January 24, suggests that the market is curre...

Read More >
U.S. Dollar / Canadian Dollar (USDCAD) Forex Elliott Wave Technical Analysis: Unveiling Bullish Momentum and Strategic Insights

U.S. Dollar / Canadian Dollar (USDCAD) Forex Elliott Wave Technical Analysis: Unveiling Bullish Momentum and Strategic Insights

Gain insights into the USDCAD Elliott Wave analysis focusing on bullish momentum in wave 5. Explore ...

Read More >
Apple Inc.(AAPL:NASDAQ) Elliott Wave Technical Analysis 12 December 23

Apple Inc.(AAPL:NASDAQ) Elliott Wave Technical Analysis 12 December 23

Apple Inc. (AAPL: NASDAQ) Elliott Wave Technical Analysis dated 12 December 23, Elliott Wave Analysi...

Read More >
Australian Dollar / Japanese Yen (AUDJPY) Elliott Wave Analysis: Insights into Daily and 4-Hour Chart, Corrective Phase, Wave Patterns

Australian Dollar / Japanese Yen (AUDJPY) Elliott Wave Analysis: Insights into Daily and 4-Hour Chart, Corrective Phase, Wave Patterns

The Australian Dollar to Japanese Yen (AUDJPY) pair is currently in a corrective phase within the El...

Read More >

Buy 1 Month

Get 3 Months!

Special Offer:

Trade Recommendations

Unleash the power of deversified trading with our comprehensive portfolio, covering:

  • Stock Trades
  • Crypto Trades
  • Forex Trades
  • Commodity Trades
Elliott Wave Analysis

Gain a competive edge with expert insights in to:

  • Global Indices
  • US Stocks & ASX Stocks
  • Forex & Crypto
  • Commodities
Top-Notch Trading Tools

Equip yourself with the tools of success:

  • Social Chat
  • Elliott Wave Algorithm
  • Screener
  • TradingLevels
  • Trading Game
7 Elliott Wave Analysts

Stay ahead of the market with daily charts and insightful videos
-Your secret to strategic trading!

JOIN HERE


Welcome to TradingLounge (ASIC A.R.No. 321187), specialists in trades, trading education and technical analysis, covering stocks, indices, commodities, forex and cryptocurrencies.

When you join TradingLounge you have access to everything we offer, including trade tools, educational content and a social platform to chat with like-minded investors.

Read more

@Copyright 2024 by tradinglounge.com

Contact Us

Australian no: 02 4787 6020

International no: +61 (2) 47876020

Pay with:

Find us on