Berkshire Hathaway Inc., Elliott Wave Technical Analysis
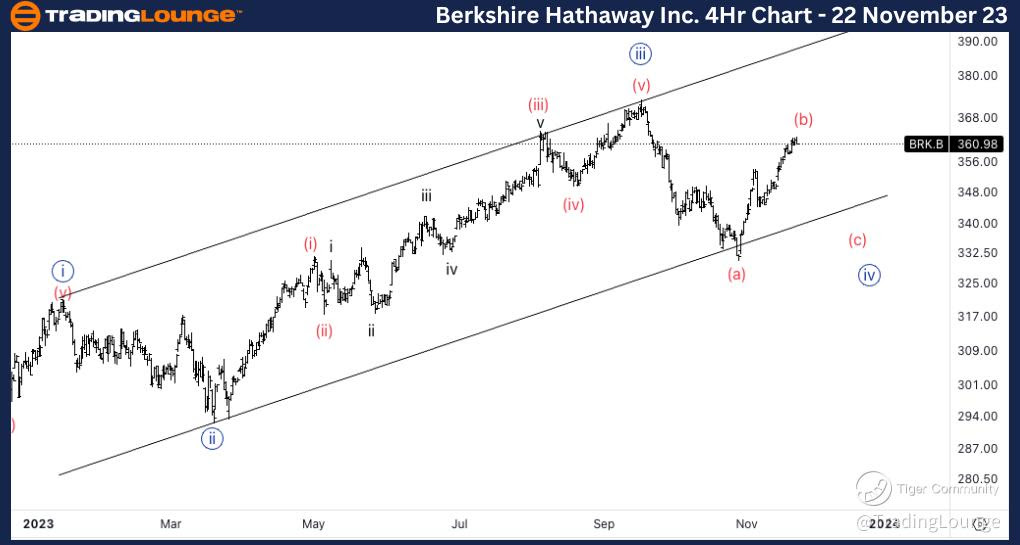
Berkshire Hathaway Inc., (BRK.B:NYSE): 4h Chart 22 November 23
BRK.B Stock Market Analysis: We are starting to take a look at the bullish scenario for Berkshire. Looking for a potential three wave move into wave {iv} considering there is a scenario where wave {iv} is already in place.
BRK.B Elliott Wave Count: Wave (b) of {iv}.
BRK.B Technical Indicators: Above all averages.
BRK.B Trading Strategy: Looking for longs into wave {v} once we have further confirmation.
TradingLounge Analyst: Alessio Barretta
Source: Tradinglounge.com get trial here!

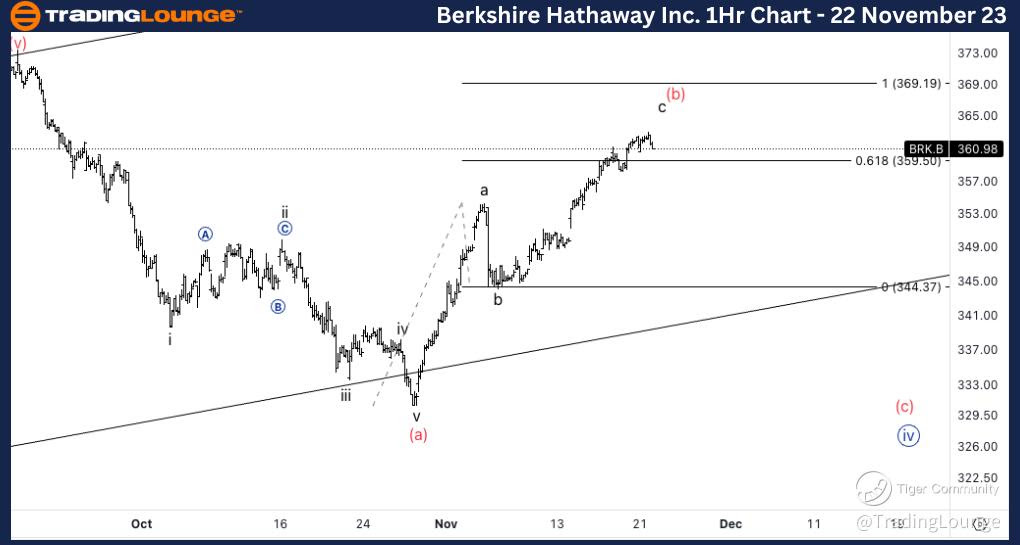
Berkshire Hathaway Inc., BRK.B: 1-hour Chart, 22 November 23
Berkshire Hathaway Inc., Elliott Wave Technical Analysis
BRK.B Stock Market Analysis: Looking for equality of c vs. a as upside target for wave c of (b). We could expect resistance on minor level at 365$, as we are already seeing RSI bearish divergence.
BRK.B Elliott Wave count: Wave c of (b).
BRK.B Technical Indicators: Above all averages.
BRK.B Trading Strategy: Looking for potential short term shorts if 358 provides retested resistance.
