02Jul

Mahindra & Mahindra Stock Elliott Wave Analysis Shows Bullish Trend and Strong Forecast with Wave 5 Now in Progress

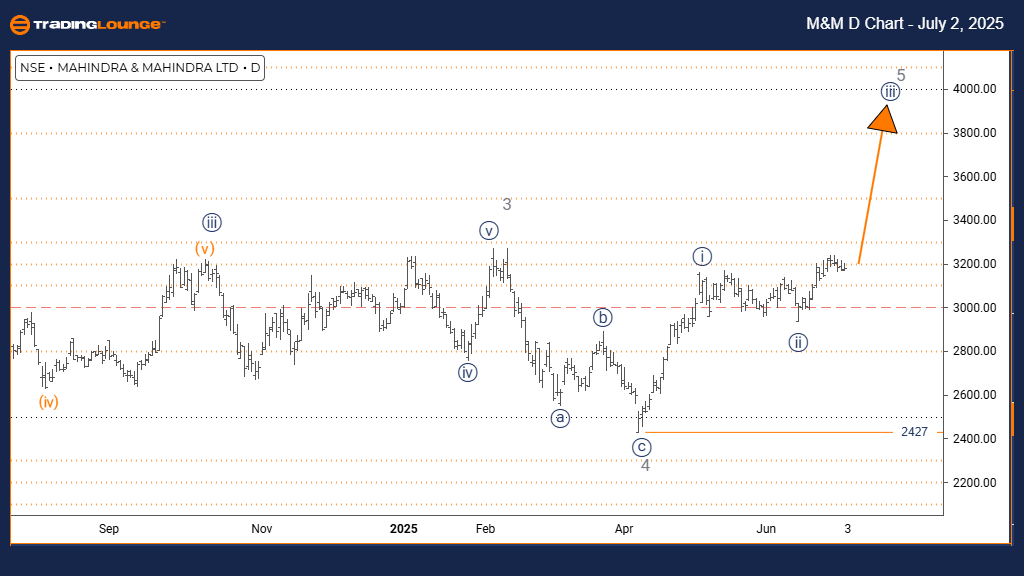
MAHINDRA & MAHINDRA – Elliott Wave Analysis (Daily Chart) – Trading Lounge

M&M Elliott Wave Technical Overview

FUNCTION: Bullish Trend

MODE: Impulsive

STRUCTURE: Navy Blue Wave 3

POSITION: Gray Wave 5

NEXT HIGHER DEGREE DIRECTION: Navy Blue Wave 3 (In Progress)

DETAILS: Navy Blue Wave 2 has completed. Navy Blue Wave 3 within Gray Wave 5 is currently active.

Wave Cancel Invalidation Level: 2427

The Elliott Wave daily analysis for MAHINDRA & MAHINDRA stock presents a strong bullish outlook, with the stock currently advancing in an impulsive phase. The ongoing wave count identifies the current move as Navy Blue Wave 3, a substructure within Gray Wave 5, suggesting momentum-backed upward movement as part of the larger bullish pattern.

Following the apparent completion of Navy Blue Wave 2, the structure has transitioned into Navy Blue Wave 3 of Gray Wave 5. In Elliott Wave theory, third waves are typically the most dynamic and strong, indicating potential for further gains in share price.

The critical invalidation level is 2427. If the stock price dips below this support, the current Elliott Wave count would be invalidated, and the bullish case would need reassessment. Until then, the technical outlook remains upward-biased.

With the stock progressing through an impulsive third wave and forming the inner structure of a fifth wave, investors and traders should note the increasing potential for a trend peak, though short-term gains may still be achievable.

MAHINDRA-d-indian-st...


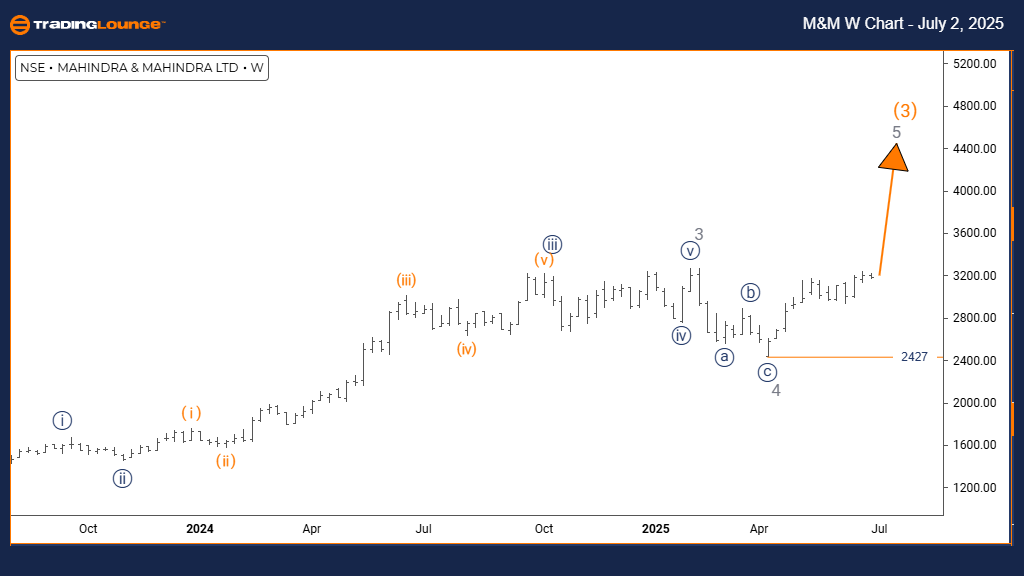
MAHINDRA & MAHINDRA – Elliott Wave Analysis (Weekly Chart)  – Trading Lounge

M&M Elliott Wave Technical Overview

FUNCTION: Bullish Trend

MODE: Impulsive

STRUCTURE: Gray Wave 5

POSITION: Orange Wave 3

NEXT LOWER DEGREE DIRECTION: Orange Wave 4

DETAILS: Gray Wave 4 has likely completed. Gray Wave 5 is currently active.

Wave Cancel Invalidation Level: 2427

The weekly Elliott Wave analysis for MAHINDRA & MAHINDRA supports a bullish market trend. The price action remains impulsive, confirming ongoing upward pressure. The wave structure is now unfolding as Gray Wave 5, fitting within the broader Orange Wave 3 cycle. This phase typically represents the final thrust in a bullish pattern before corrective moves set in.

As per current wave counts, Gray Wave 4 has ended, and Gray Wave 5 is in motion. This wave is usually characterized by increased buying and a final push higher. Once it completes, Orange Wave 4, the subsequent corrective phase, is expected to start.

A drop below the 2427 invalidation level would void this wave count and call for an updated analysis. As long as price stays above that mark, the bullish Elliott Wave scenario stays intact.

With Gray Wave 5 in progress, investors might observe short-term bullish potential. However, since this move represents a fifth wave within a third wave, traders should remain alert for signs of an upcoming cycle peak.

Technical Analyst: Malik Awais

Source: Visit Tradinglounge.com and learn from the Experts. Join TradingLounge Here

Previous: COAL INDIA Elliott Wave Technical Analysis

VALUE Offer - Buy 1 Month & Get 3 Months!Click here

Access 7 Analysts Over 200 Markets Covered. Chat Room With Support

MAHINDRA-w-indian-st...

Related

Learn about the current stock trend: Texas Instruments Inc.(TXN) Stocks Elliott Wave Technical Analysis

Learn about the current stock trend: Texas Instruments Inc.(TXN) Stocks Elliott Wave Technical Analysis

Explore an in-depth Elliott Wave analysis for Texas Instruments Inc. (TXN), including daily and 4-ho...

Read More >
 Forex USD/JPY Currency Pair and U.S. Dollar/Japanese Yen (USDJPY) Forex Elliott Wave Technical Analysis

Forex USD/JPY Currency Pair and U.S. Dollar/Japanese Yen (USDJPY) Forex Elliott Wave Technical Analysis

Gain in-depth USD/JPY Elliott Wave analysis knowledge with our comprehensive guide. Learn about curr...

Read More >
Comprehensive Grasim Industries Stock Analysis: Elliott Wave Forecast and Technical Insights for Informed Trading

Comprehensive Grasim Industries Stock Analysis: Elliott Wave Forecast and Technical Insights for Informed Trading

This analysis provides a detailed Elliott Wave forecast and technical analysis for Grasim Industries...

Read More >
PaloAlto Networks Inc. stock price towards key levels: PANW Elliott Wave Technical Analysis and Potential Upside

PaloAlto Networks Inc. stock price towards key levels: PANW Elliott Wave Technical Analysis and Potential Upside

This detailed analysis of Palo Alto Networks (PANW) stock uses Elliott Wave Theory to explore the cu...

Read More >
LINKUSD Elliott Wave Analysis: Chainlink Price Forecast, Fibonacci Levels, Support and Resistance Insights for Crypto Traders

LINKUSD Elliott Wave Analysis: Chainlink Price Forecast, Fibonacci Levels, Support and Resistance Insights for Crypto Traders

LINK/USD Elliott Wave analysis to understand Chainlink's price movements and potential trends. E...

Read More >
AAVE/ U.S. dollar(AAVEUSD) Elliott Wave Technical Analysis: Explore the corrective phase within the Zigzag pattern

AAVE/ U.S. dollar(AAVEUSD) Elliott Wave Technical Analysis: Explore the corrective phase within the Zigzag pattern

In this Elliott Wave analysis and trading strategy overview for AAVE/USD (AAVEUSD) on February 26, w...

Read More >

$1 for 2 Weeks

then $29 a month!

What a Special Offer!

Trade Recommendations

Unleash the power of deversified trading with our comprehensive portfolio, covering 250+ markets:

  • Stock Trades
  • Crypto Trades
  • Forex Trades
  • Commodity Trades
Elliott Wave Analysis

Gain a competitive edge with expert insights and AI-powered Elliott Wave charting into:

  • Global Indices
  • US Stocks & ASX Stocks
  • Forex & Crypto
  • Commodities
Top-Notch Trading Tools

Equip yourself with the tools of success:

  • Real-time Chat rooms
  • Elliott Wave Algorithm
  • Portfolio tools
  • TradingLevels
  • Screener
  • Trading Game
7 Elliott Wave Analysts

Stay ahead of the market with daily charts and insightful videos
Your secret to strategic trading!

JOIN HERE


Welcome to TradingLounge (ASIC A.R.No. 321187), specialists in trades, trading education and technical analysis, covering stocks, indices, commodities, forex and cryptocurrencies.

When you join TradingLounge you have access to everything we offer, including trade tools, educational content and a social platform to chat with like-minded investors.

Read more

@Copyright 2024 by tradinglounge.com

Contact Us

Australian no: 02 4787 6020

International no: +61 (2) 47876020

Pay with:

Find us on