01Jul

COAL INDIA Elliott Wave Chart Analysis: Daily and Weekly Forecasts Revealing Wave C’s Role in Impulsive Correction Phase

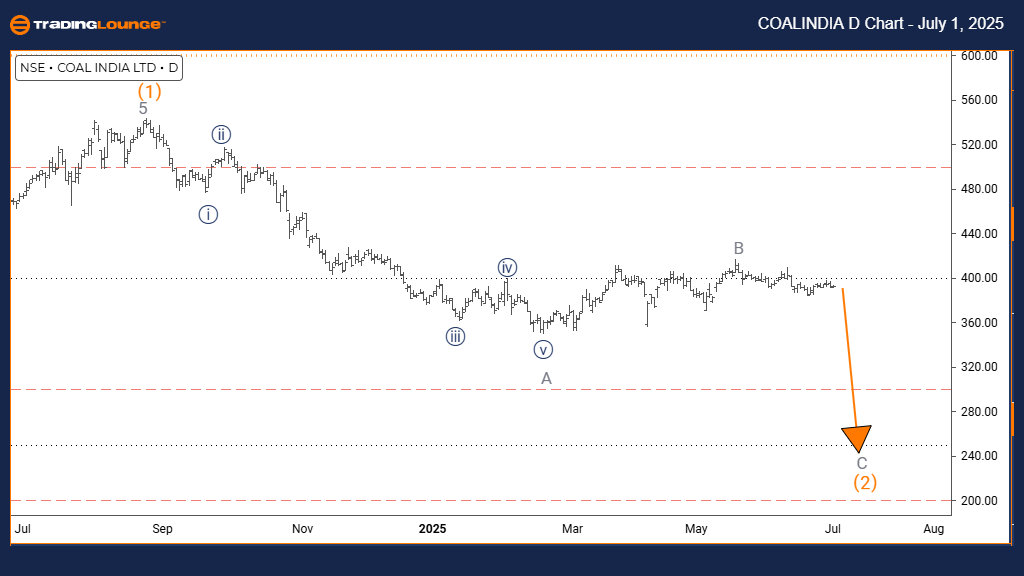
COAL INDIA Elliott Wave Analysis – TradingLounge Daily Chart

COAL INDIA Elliott Wave Technical Overview

Function: Counter-Trend

Mode: Impulsive

Structure: Gray Wave C

Position: Orange Wave 4

Direction (Lower Degrees): Gray Wave C (Started)

Details: Completion of Gray Wave B followed by initiation of Gray Wave C

Daily Chart Summary
The daily Elliott Wave analysis of COAL INDIA stock reflects a counter-trend scenario. Price action currently follows an impulsive wave pattern, suggesting a strong move against the broader market trend. The identified wave, Gray Wave C, is unfolding within the corrective structure of Orange Wave 4, signaling a potential nearing of the correction's conclusion.

Wave B to C Transition
The completed Gray Wave B phase has initiated Gray Wave C, marking a decisive segment in the counter-trend. Gray Wave C typically represents the final wave within a correction, characterized by increased momentum in the opposite direction of the primary trend. This movement continues within the framework of Orange Wave 4.

Technical Outlook
At present, COAL INDIA appears to be progressing through the final stage of a corrective move. With the impulsive nature of Gray Wave C gaining traction and Gray Wave B completed, downward price momentum is likely. Traders should closely monitor for reversal signs, as this phase often precedes the end of the Orange Wave 4 correction.

COAL-d-indian-chart-...


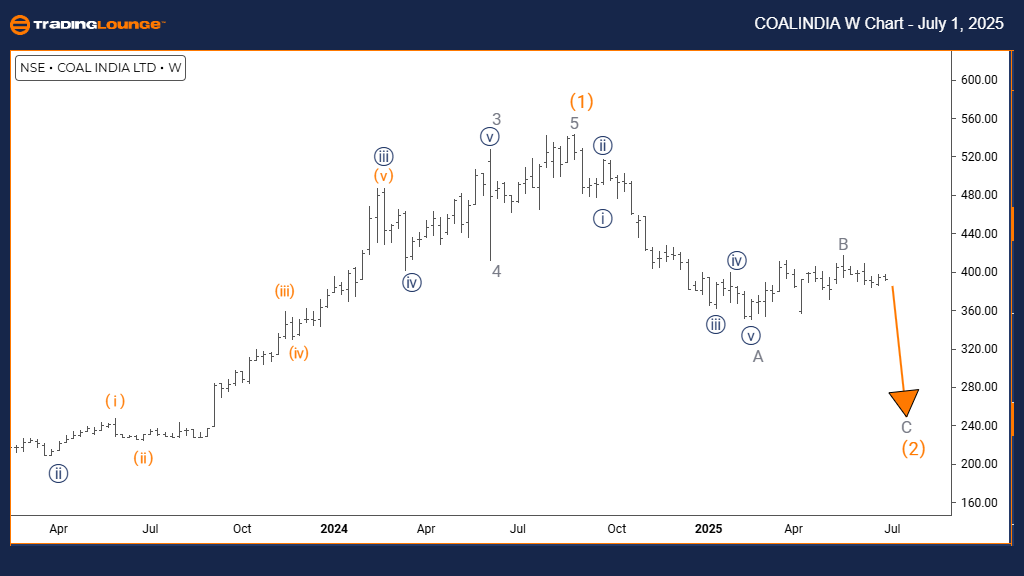
COAL INDIA Elliott Wave Analysis – TradingLounge Weekly Chart

COAL INDIA Elliott Wave Technical Overview

Function: Counter-Trend

Mode: Impulsive

Structure: Gray Wave C

Position: Orange Wave 4

Direction (Lower Degrees): Gray Wave C (Started)

Details: Gray Wave B is complete, and Gray Wave C is actively developing

Weekly Chart Summary
The weekly Elliott Wave analysis of COAL INDIA reveals a strong counter-trend impulse. Price movement is advancing against the prevailing trend, structured as Gray Wave C within the larger Orange Wave 4 corrective phase. This pattern suggests that the stock may be approaching the end of its ongoing correction.

Wave B to C Shift
With Gray Wave B appearing to be finalized, the market has transitioned into Gray Wave C. This wave is significant as it usually culminates the corrective trend, pushing with considerable momentum opposite to the dominant price direction. The current progression remains nested within the Orange Wave 4 formation.

Technical Outlook
COAL INDIA seems to be advancing through the latter phase of its counter-trend cycle. The presence of Gray Wave C, along with a completed Wave B, supports expectations of continued impulsive selling. Market participants should be alert to trend-reversal indicators as Gray Wave C might wrap up the larger correction seen in Orange Wave 4.

Technical Analyst: Malik Awais

Source: Visit Tradinglounge.com and learn from the Experts. Join TradingLounge Here

Previous: ADANI PORTS & SEZ Elliott Wave Technical Analysis

VALUE Offer - $1 for 2 Weeks then $29 a month!Click here

Access 7 Analysts Over 200 Markets Covered. Chat Room With Support

COAL-w-indian-chart-...

Related

WTC Stock with Precise Technical Chart Analysis and Expert Market Forecasts: WiseTech Global Limited Elliott Wave Technical Forecast

WTC Stock with Precise Technical Chart Analysis and Expert Market Forecasts: WiseTech Global Limited Elliott Wave Technical Forecast

Explore our comprehensive Elliott Wave analysis of WiseTech Global Limited (WTC) on the ASX. Underst...

Read More >
Comprehensive Dogecoin/ U.S. dollar (DOGEUSD) Elliott Wave Analysis: Crypto Trading Strategies and Technical Indicators

Comprehensive Dogecoin/ U.S. dollar (DOGEUSD) Elliott Wave Analysis: Crypto Trading Strategies and Technical Indicators

Delve into an in-depth Elliott Wave Technical analysis of Dogecoin/ U.S. dollar(DOGEUSD), revealing ...

Read More >
Spotify Technology S.A. (SPOT) Stock Forecast Using Elliott Wave Analysis: Technical Chart Outlook, and Price Target Toward $800

Spotify Technology S.A. (SPOT) Stock Forecast Using Elliott Wave Analysis: Technical Chart Outlook, and Price Target Toward $800

Spotify Technology S.A. (SPOT) applies Elliott Wave Theory to both daily and intraday 1-hour charts....

Read More >
Silver (XAGUSD) Price and Elliott Wave Technical Analysis: Buy the Dip for Profitable Silver Trading

Silver (XAGUSD) Price and Elliott Wave Technical Analysis: Buy the Dip for Profitable Silver Trading

This comprehensive guide offers valuable insights into Silver trading, covering essential topics suc...

Read More >
Comprehensive Euro/British Pound (EURGBP) Forex Elliott Wave Technical Analysis: Bearish Trends and Forecast

Comprehensive Euro/British Pound (EURGBP) Forex Elliott Wave Technical Analysis: Bearish Trends and Forecast

Gain in-depth insights into EURGBP trends with our Elliott Wave analysis. Discover bearish forecasts...

Read More >
Understanding MSTR US Stock Market Trajectory and Support Levels: MicroStrategy Inc. (MSTR) Elliott Wave Technical Analysis

Understanding MSTR US Stock Market Trajectory and Support Levels: MicroStrategy Inc. (MSTR) Elliott Wave Technical Analysis

Explore the Elliott Wave Theory as applied to MicroStrategy Inc. (MSTR), providing a comprehensive a...

Read More >

$1 for 2 Weeks

then $29 a month!

What a Special Offer!

Trade Recommendations

Unleash the power of deversified trading with our comprehensive portfolio, covering 250+ markets:

  • Stock Trades
  • Crypto Trades
  • Forex Trades
  • Commodity Trades
Elliott Wave Analysis

Gain a competitive edge with expert insights and AI-powered Elliott Wave charting into:

  • Global Indices
  • US Stocks & ASX Stocks
  • Forex & Crypto
  • Commodities
Top-Notch Trading Tools

Equip yourself with the tools of success:

  • Real-time Chat rooms
  • Elliott Wave Algorithm
  • Portfolio tools
  • TradingLevels
  • Screener
  • Trading Game
7 Elliott Wave Analysts

Stay ahead of the market with daily charts and insightful videos
Your secret to strategic trading!

JOIN HERE


Welcome to TradingLounge (ASIC A.R.No. 321187), specialists in trades, trading education and technical analysis, covering stocks, indices, commodities, forex and cryptocurrencies.

When you join TradingLounge you have access to everything we offer, including trade tools, educational content and a social platform to chat with like-minded investors.

Read more

@Copyright 2024 by tradinglounge.com

Contact Us

Australian no: 02 4787 6020

International no: +61 (2) 47876020

Pay with:

Find us on