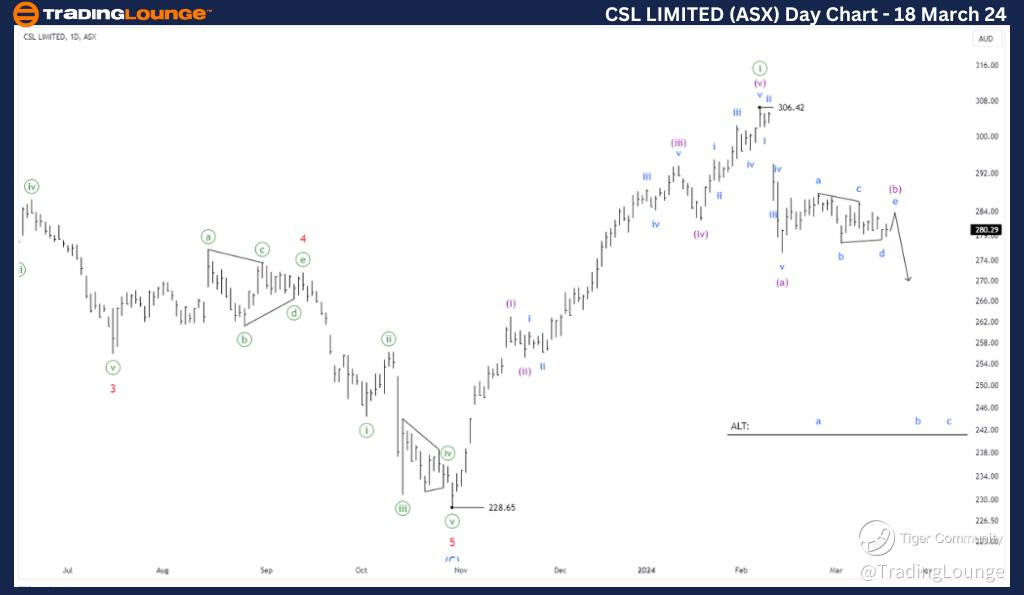
CSL LIMITED (ASX): CSL Elliott Wave Technical Analysis TradingLounge (1D Chart), March 18, 2024

Greetings, Our Elliott Wave analysis today updates the Australian Stock Exchange (ASX) with CSL Limited (CSL) shares. We have identified a Triangle correction pattern, indicating the potential for CSL to continue declining further.

CSL LIMITED (ASX): CSL Elliott Wave Technical Analysis

CSL LIMITED (ASX): CSL 1D Chart (Semilog Scale) Analysis

Function: Counter trend (Minute degree, green)

Mode: Corrective

Structure: Zigzag

Position: Wave (c)-purple of wave ((ii))-green

Details: Short-term outlook shows wave ((ii))-green unfolding with Zigzag correction, wave (a)-purple completed, wave (b) is unfolding with Triangle correction and will probably end soon with wave e-blue is about to peak, and this will be followed by wave (c)-purple returning lower. However a move higher than 287.77 would suggest an alternative wave count (ALT) is underway.

Invalidation point: 287.77

Confirmation point: Falling below the low at 277.54


CSL-LIMITED-ASX-Day-...


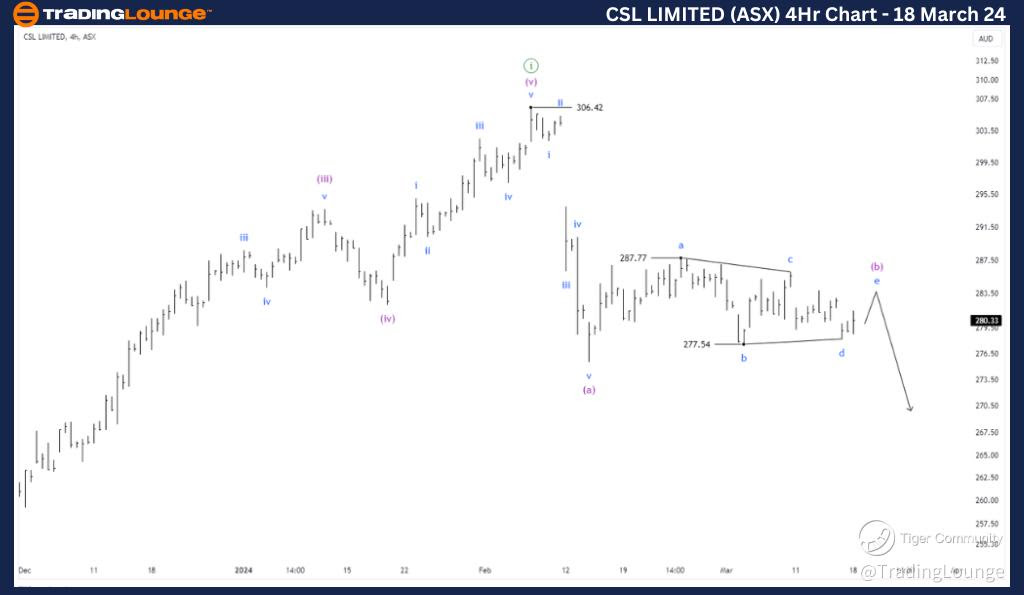
TradingLounge Elliott Wave Analysis for CSL LIMITED (ASX): CSL 4-Hour Chart, 18 March 24

CSL LIMITED (ASX): CSL Elliott Wave Technical Analysis

CSL LIMITED (ASX): CSL 4-Hour Chart Analysis

Function: Counter trend (Minuette degree, purple)

Mode: Corrective

Structure: Triangle

Position: Wave e-blue of Wave (b)-purple

Details: The short-term outlook on the 4-hour chart indicates that wave (b)-purple is unfolding within a Triangle pattern. It seems that wave d-blue has just concluded, and wave e-blue is continuing its process. A drop below 277.54 will show that the bear market is gaining more confidence, whereas a rise above 287.77 will suggest the invalidation of this Triangle correction, prompting a reassessment of the situation.

Invalidation point: 287.77

Confirmation point: Falling below the low at 277.54

Conclusion:

Our analysis, forecast of contextual trends, and short-term outlook for ASX: CSL LIMITED (CSL) provide readers with an idea of what the upcoming trends are in the market, and how to take advantage of them. to exploit the best positions. Furthermore, we provide specific prices that act as if the wave count was invalidated (we know how wrong we were) and prices that show confirmation for the wave count to increase confidence. for that prospect. Combining all of these factors gives readers the most objective and professional perspective and opinion on trends.

Technical Analyst: Cuong (Shane) Hua, CEWA-M

Source: visit Tradinglounge.com and learn From the Experts Join TradingLounge Here 

TradingLounge Once Off SPECIAL DEAL: Here > 1 month Get 3 months.

CSL-LIMITED-ASX-4Hr-...

Related

Our Insights Cover Wave Patterns, and Market Trends: Australian Dollar/U.S.Dollar (AUDUSD) Forex Elliott Wave Technical Analysis

Our Insights Cover Wave Patterns, and Market Trends: Australian Dollar/U.S.Dollar (AUDUSD) Forex Elliott Wave Technical Analysis

Discover the most comprehensive AUDUSD Elliott Wave analysis and Forex trading strategies. Our exper...

Read More >
Unlock ASX Trading Potential: REA GROUP LTD Stock Analysis & REA Elliott Wave Technical Forecast

Unlock ASX Trading Potential: REA GROUP LTD Stock Analysis & REA Elliott Wave Technical Forecast

Get the latest Elliott Wave analysis for ASX REA Group. Discover key stock trends, wave counts, and ...

Read More >
British Pound/ U.S. Dollar Forex Pair and GBPUSD Elliott Wave Technical Analysis: Daily and 4H Chart for Trading Setup Opportunities

British Pound/ U.S. Dollar Forex Pair and GBPUSD Elliott Wave Technical Analysis: Daily and 4H Chart for Trading Setup Opportunities

The GBPUSD daily and 4-hour charts show a counter-trend Wave 2 correction within a broader bearish E...

Read More >
Wheat Commodity Price Forecast: Elliott Wave Setup, Key Support Zones, Bearish Exhaustion, and High-Probability Trade Opportunities

Wheat Commodity Price Forecast: Elliott Wave Setup, Key Support Zones, Bearish Exhaustion, and High-Probability Trade Opportunities

Elliott Wave analysis of the wheat market, examining the ongoing bearish trend and forecasting futur...

Read More >
In-Depth Kotak Bank Elliott Wave Analysis Reveals Key Market Trends and Potential Price Movements for Strategic Trading Decisions

In-Depth Kotak Bank Elliott Wave Analysis Reveals Key Market Trends and Potential Price Movements for Strategic Trading Decisions

This analysis delves into Kotak Bank's stock behaviour using Elliott Wave theory, highlighting c...

Read More >
U.S.Dollar /Canadian Dollar(USD/CAD)  Forex Elliott Wave Technical Analysis

U.S.Dollar /Canadian Dollar(USD/CAD)  Forex Elliott Wave Technical Analysis

Elliott Wave Analysis of the USD/CAD currency pair, providing key insights into its potential movem...

Read More >

$1 for 2 Weeks

then $29 a month!

What a Special Offer!

Trade Recommendations

Unleash the power of deversified trading with our comprehensive portfolio, covering 250+ markets:

  • Stock Trades
  • Crypto Trades
  • Forex Trades
  • Commodity Trades
Elliott Wave Analysis

Gain a competitive edge with expert insights and AI-powered Elliott Wave charting into:

  • Global Indices
  • US Stocks & ASX Stocks
  • Forex & Crypto
  • Commodities
Top-Notch Trading Tools

Equip yourself with the tools of success:

  • Real-time Chat rooms
  • Elliott Wave Algorithm
  • Portfolio tools
  • TradingLevels
  • Screener
  • Trading Game
7 Elliott Wave Analysts

Stay ahead of the market with daily charts and insightful videos
Your secret to strategic trading!

JOIN HERE


Welcome to TradingLounge (ASIC A.R.No. 321187), specialists in trades, trading education and technical analysis, covering stocks, indices, commodities, forex and cryptocurrencies.

When you join TradingLounge you have access to everything we offer, including trade tools, educational content and a social platform to chat with like-minded investors.

Read more

@Copyright 2024 by tradinglounge.com

Contact Us

Australian no: 02 4787 6020

International no: +61 (2) 47876020

Pay with:

Find us on