TradingLounge Soybean Commodity Elliott Wave Analysis

Soybean is currently experiencing a correction within its long-term bullish trend. The commodity has undergone a significant sell-off, shedding over 45% of its value since peaking at 1784 in June 2022. This sell-off appears to be nearing its final stages. The critical question now is: how much further could prices decline before a substantial reversal occurs?

Soybean Elliott Wave Technical AnalysisLong-Term Perspective

Before the downturn that started in June 2022, Soybean completed a bullish impulse wave structure that began in May 2019, when prices were at $806. Over the past 26 months, more than two-thirds of those gains have been retraced. From an Elliott Wave standpoint, this corrective phase is forming into a typical three-swing pattern, common in most corrective structures.

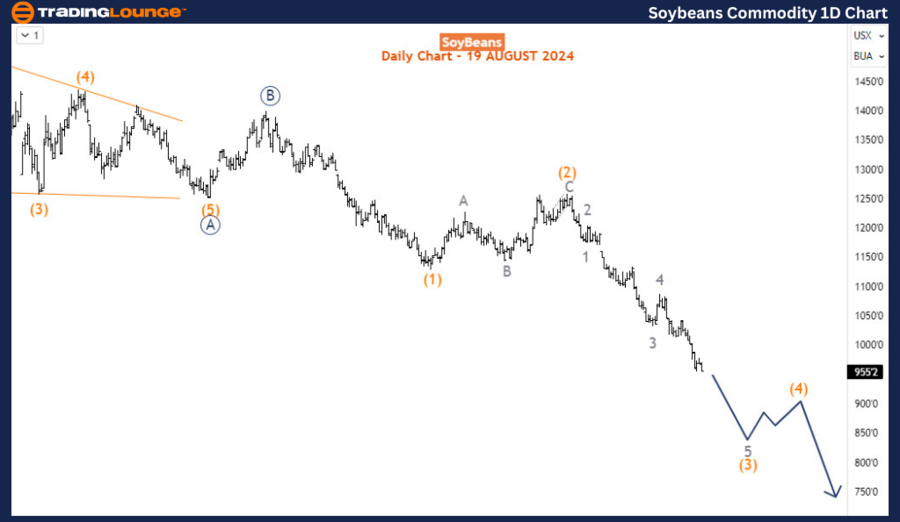
Soybean Daily Chart Analysis

On the daily chart, the emerging pattern is analyzed from the primary wave degree (circled). Wave A (circled) concluded at 1249 in October 2023, and Wave B (circled) ended at 1398 in November 2023. Currently, Wave C (circled) is unfolding to the downside. Within this wave, sub-waves (1) and (2) of 5 (circled) have been completed, with the price now progressing in Wave (3). The price has broken below the critical 1,000 level and could potentially decline to 800 before Wave (3) concludes. This movement is part of Wave 5 of (3), suggesting that the bearish phase may not be over yet. In the near term, further selling pressure is expected.

Soybean-Commodity-1D...


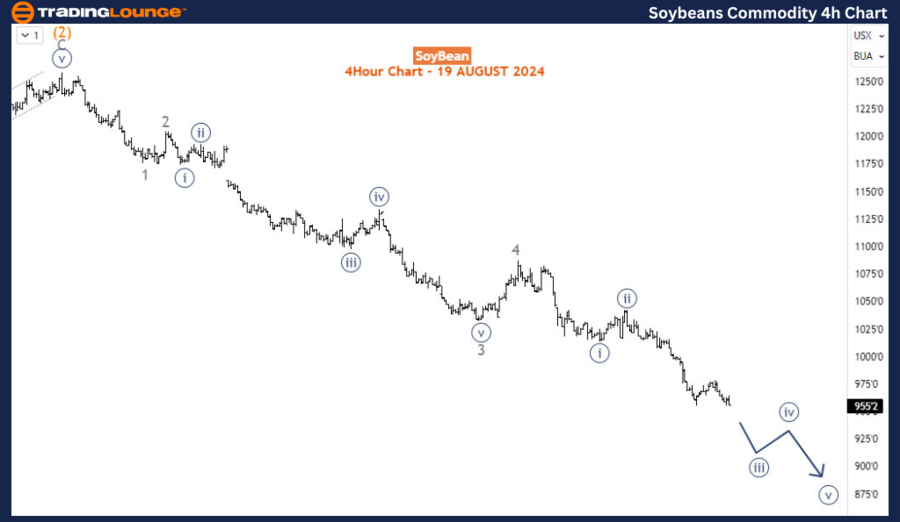
Soybean H4 Chart Analysis

On the H4 chart, Wave 5 appears to be in its 3rd sub-wave, labelled as Wave iii (circled) of 5. This indicates that Soybean is likely to continue its downward movement in the near term, favouring further sell-offs.

Conclusion

Soybeans is in the latter stages of a corrective phase following a long-term bullish trend. While the sell-off has been substantial, Elliott Wave analysis suggests that there may be further downside before a significant reversal occurs. Traders should remain cautious of continued selling pressure in the near term, as the bearish phase may still have more ground to cover before a bottom is established.

Technical Analyst: Sanmi Adeagbo

Source: visit Tradinglounge.com and learn From the Experts Join TradingLounge Here 

See Previous: Natural Gas Index Elliott Wave Technical Analysis

Special Trial Offer - 0.76 Cents a Day for 3 Months! Click here

Access 7 Analysts Over 200 Markets Covered. Chat Room With Support

Soybean-Commodity-4h...

Related

ChainLink Crypto Price News Today: Elliott Wave Forecast & Effective Trading Strategies

ChainLink Crypto Price News Today: Elliott Wave Forecast & Effective Trading Strategies

This article provides a thorough analysis of ChainLink (LINKUSD) using Elliott Wave principles. It c...

Read More >
Vanguard ASX Index Elliott Wave analysis and technical insights for ASX: V300AEQ ETF UNITS Our Report Covers Market Trends

Vanguard ASX Index Elliott Wave analysis and technical insights for ASX: V300AEQ ETF UNITS Our Report Covers Market Trends

Get comprehensive Elliott Wave analysis and technical insights for ASX: V300AEQ ETF UNITS – VAS. Ou...

Read More >
Stock Market Topping: SP500, NASDAQ, DAX 40, FTSE 100, ASX200. Elliott Wave Insights & Strategies

Stock Market Topping: SP500, NASDAQ, DAX 40, FTSE 100, ASX200. Elliott Wave Insights & Strategies

Tech stocks currently undergoing an ABC Zigzag correction pattern, impacting Nasdaq 100, S&P 500, an...

Read More >
British Pound/ Australian Dollar(GBPAUD) Chart Elliott Wave Technical Analysis 18 October 23

British Pound/ Australian Dollar(GBPAUD) Chart Elliott Wave Technical Analysis 18 October 23

In summary, the GBPAUD Elliott Wave Analysis for 18 October 23, delivers essential insights for trad...

Read More >
Netflix (NFLX) Set for Major Rally: NFLX Stocks Elliott Wave Technical Analysis Reveals $800 Price Target

Netflix (NFLX) Set for Major Rally: NFLX Stocks Elliott Wave Technical Analysis Reveals $800 Price Target

This article provides a detailed Elliott Wave analysis of Netflix Inc. (NFLX), offering insights int...

Read More >
Ethereum/ U.S. dollar(ETHUSD) Elliott Wave Technical Analysis 15 November 23

Ethereum/ U.S. dollar(ETHUSD) Elliott Wave Technical Analysis 15 November 23

Ethereum/ U.S. dollar(ETHUSD) Elliott Wave Technical Analysis on 15 November 23 with daily chart.

Read More >

Buy 1 Month

Get 3 Months!

Special Offer:

Trade Recommendations

Unleash the power of deversified trading with our comprehensive portfolio, covering:

  • Stock Trades
  • Crypto Trades
  • Forex Trades
  • Commodity Trades
Elliott Wave Analysis

Gain a competive edge with expert insights in to:

  • Global Indices
  • US Stocks & ASX Stocks
  • Forex & Crypto
  • Commodities
Top-Notch Trading Tools

Equip yourself with the tools of success:

  • Social Chat
  • Elliott Wave Algorithm
  • Screener
  • TradingLevels
  • Trading Game
7 Elliott Wave Analysts

Stay ahead of the market with daily charts and insightful videos
-Your secret to strategic trading!

JOIN HERE


Welcome to TradingLounge (ASIC A.R.No. 321187), specialists in trades, trading education and technical analysis, covering stocks, indices, commodities, forex and cryptocurrencies.

When you join TradingLounge you have access to everything we offer, including trade tools, educational content and a social platform to chat with like-minded investors.

Read more

@Copyright 2024 by tradinglounge.com

Contact Us

Australian no: 02 4787 6020

International no: +61 (2) 47876020

Pay with:

Find us on