CIPLA Elliott Wave Analysis | TradingLounge Daily Chart
CIPLA Elliott Wave Technical Analysis
FUNCTION: Counter Trend
MODE: Corrective
STRUCTURE: Orange wave Y
POSITION: Navy blue wave 2
DIRECTION NEXT LOWER DEGREES: Orange wave Y (in progress)
Details:
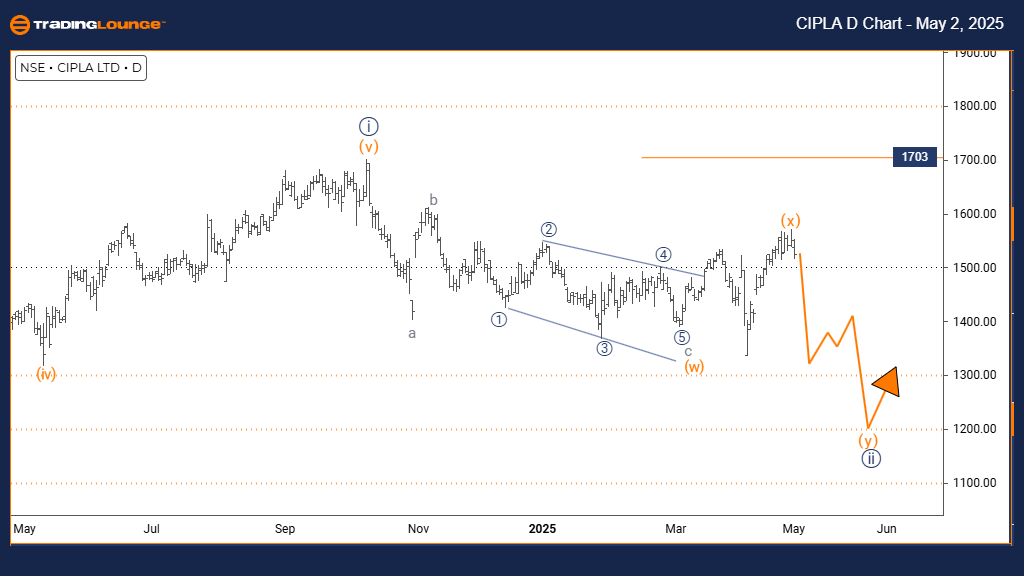
CIPLA's daily Elliott Wave analysis reveals a counter-trend correction emerging within a broader bearish market structure. The stock has completed orange wave X and is currently unfolding orange wave Y within the larger navy blue wave 2 framework. This movement signals a temporary upward retracement before the potential resumption of the primary downward trend.
Orange wave Y represents the corrective phase, typically retracing between 38% and 61% of the previous decline and often forming complex patterns like double or triple threes. The conclusion of orange wave X’s decline has opened the path for this corrective advance, generally characterized by overlapping price action and diminishing momentum. The daily chart perspective points to a medium-term consolidation phase within a prevailing bearish trend.
The next expected movement involves the finalization of orange wave Y’s corrective structure, paving the way for a renewed downward trend. A key invalidation level to monitor is 1703 — a break above this point would necessitate a revision of the current Elliott Wave count. Traders should look for typical correction-ending signals such as bearish candlestick patterns and overbought momentum indicators.
This corrective phase presents a tactical opportunity for traders to prepare for the anticipated downward continuation. Utilizing technical tools and Fibonacci retracement levels will be critical in timing the transition. The current chart setup suggests that CIPLA could resume its broader downtrend upon completion of the current corrective wave Y.
Monitoring price behavior around significant Fibonacci retracement zones will be crucial for identifying strategic entry points. The daily Elliott Wave analysis reinforces the importance of this corrective structure within the overall bearish outlook. Technical indicators and price pattern formations will play a key role in confirming the end of the correction.
CIPLA Elliott Wave Analysis | TradingLounge Weekly Chart
CIPLA Elliott Wave Technical Analysis
FUNCTION: Counter Trend
MODE: Corrective
STRUCTURE: Navy blue wave 2
POSITION: Gray wave 3
DIRECTION NEXT HIGHER DEGREES: Navy blue wave (unfolding)
Details:
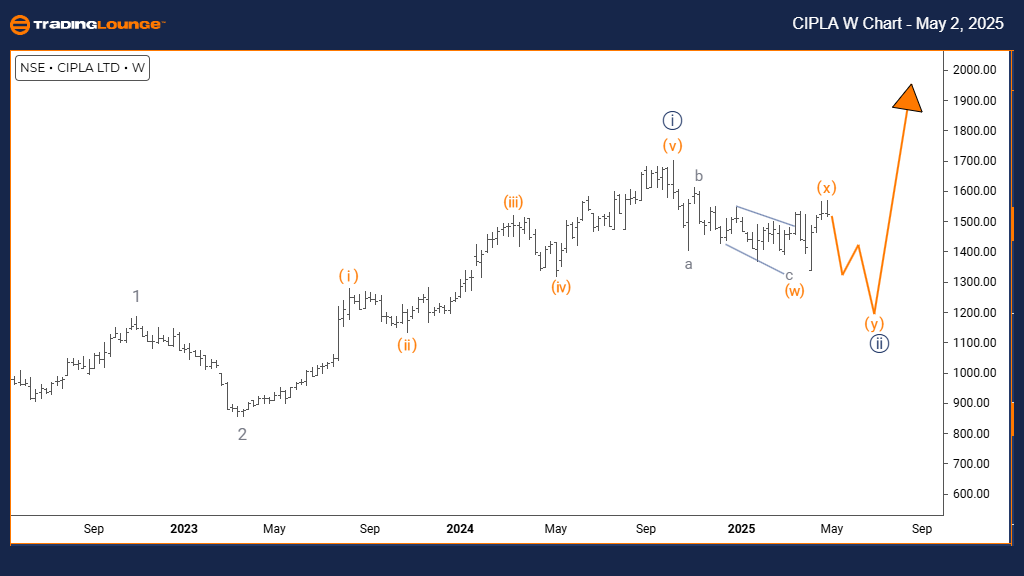
CIPLA's weekly Elliott Wave analysis identifies a counter-trend corrective movement forming within a broader long-term bearish setup. The stock has completed navy blue wave 1’s impulsive decline and is now progressing through corrective navy blue wave 2 within the larger gray wave 3 downtrend. This structure suggests a temporary retracement higher before the likely continuation of the dominant bearish move.
Navy blue wave 2 marks the corrective phase, usually retracing between 38% and 61% of navy blue wave 1’s decline, often forming classic patterns such as zigzags, flats, or combinations. The conclusion of wave 1’s strong downward impulse has initiated this corrective rally, typically featuring overlapping wave patterns and weakening upside momentum. The weekly timeframe analysis suggests a medium-term consolidation before the primary trend resumes.
The next phase anticipated is the start of navy blue wave 3, expected to be the strongest and most impulsive downward leg, significantly surpassing the low of navy blue wave 1. Traders should closely watch wave 2 for completion signs, such as bearish reversal candlesticks and technical indicators signaling overbought conditions.
This corrective stage creates a prime setup for positioning ahead of the anticipated wave 3 decline. Advanced technical analysis, including monitoring key Fibonacci retracement levels, will be essential to validate the end of wave 2 and the commencement of a fresh bearish impulse. The Elliott Wave structure suggests that CIPLA could soon begin its next strong decline once the corrective phase concludes.
Close observation of price action and volume around critical Fibonacci levels will be vital for effective trade planning. The weekly Elliott Wave chart highlights the significance of this corrective phase within the larger bearish narrative. Confirmation through technical indicators and detailed wave structure analysis will guide trading strategies as this pattern evolves.
Technical Analyst: Malik Awais
Source: Visit Tradinglounge.com and learn from the Experts. Join TradingLounge Here
Previous: BHARAT ELECTRONICS Elliott Wave Technical Analysis
VALUE Offer - Buy 1 Month & Get 3 Months!Click here
Access 7 Analysts Over 200 Markets Covered. Chat Room With Support