15Nov

Precise Market Analysis to Enhance Your AUDJPY Trading Strategy: Australian Dollar/Japanese Yen Elliott Wave Technical Analysis

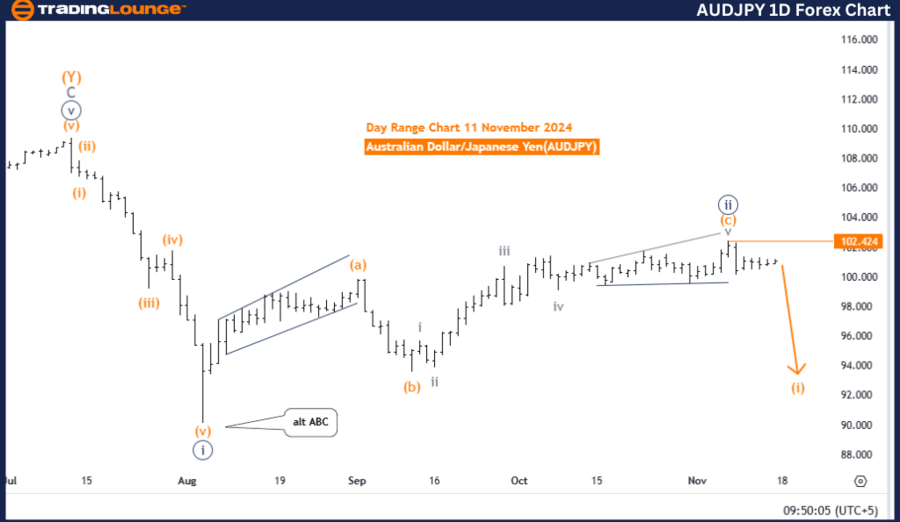
Australian Dollar / Japanese Yen (AUDJPY) – Day Chart Analysis

AUDJPY Elliott Wave Technical Analysis

Function: Bearish Trend

Mode: Impulsive

Structure: Orange Wave 1

Position: Navy Blue Wave 3

Next Higher Degree Direction: Orange Wave 2

Analysis Summary

The daily chart of AUDJPY indicates a strong bearish trend under Elliott Wave analysis. The ongoing downward momentum fits within an impulsive wave structure, where orange wave 1 is actively forming inside navy blue wave 3. This alignment underscores persistent bearish sentiment in the market.

  • Navy Blue Wave 2: Completed, allowing orange wave 1 of 3 to unfold further.
  • Wave Invalidation Level: Set at 102.424, marking a crucial threshold for trend validation.

Wave Analysis Details

  • Orange Wave 1 Activity: Represents the early stages of a broader downward phase in navy blue wave 3, setting the tone for continued bearish pressure.

  • Wave 3 Significance: As per Elliott Wave theory, wave 3 typically represents the strongest segment of a trend, intensifying the bearish momentum.
  • Implication: This wave structure suggests AUDJPY may experience further declines as orange wave 1 unfolds.

The development of navy blue wave 3 supports a bearish trajectory, signaling that the pair holds substantial potential for continued downside momentum.

Invalidation Level and Trading Implications

The invalidation level for the bearish Elliott Wave count is established at 102.424. A price movement above this level would:

  • Invalidate the current wave count.
  • Suggest a potential trend reversal or weakening of bearish sentiment.

For traders, this invalidation level acts as a critical benchmark to:

  • Confirm the continuation of the bearish trend.
  • Prompt reassessment of trading strategies if breached.

Conclusion

The Elliott Wave analysis for AUDJPY on the daily chart projects a bearish outlook. The active progress of orange wave 1 within navy blue wave 3 suggests continued downside movement. Nevertheless, the invalidation level at 102.424 remains a key focus for traders, as breaching this point would challenge the bearish framework and signal a potential trend reversal.

AUDJPY-1D-Forex-Char...


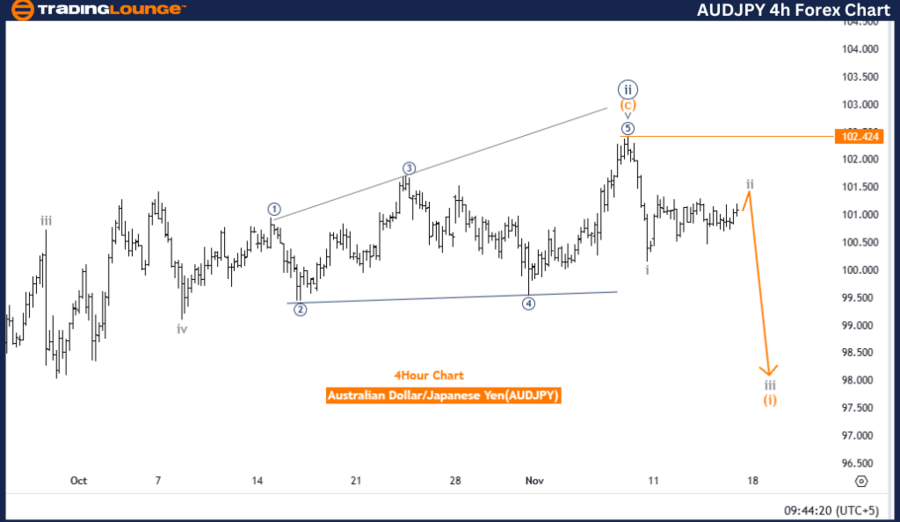
Australian Dollar / Japanese Yen (AUDJPY) – 4-Hour Chart Analysis

AUDJPY Elliott Wave Technical Analysis

Function: Bearish Trend

Mode: Impulsive

Structure: Orange Wave 1

Position: Navy Blue Wave 3

Next Higher Degree Direction: Orange Wave 2

Analysis Summary

The 4-hour chart of AUDJPY continues to highlight a bearish trend, supported by an impulsive wave structure. Orange wave 1 is actively progressing within the broader navy blue wave 3, emphasizing sustained downward pressure.

  • Navy Blue Wave 2: Completed, paving the way for Orange Wave 1 of Navy Blue Wave 3 to develop.
  • Wave Invalidation Level: Defined at 102.424, representing a crucial threshold for the bearish outlook.

Wave Analysis Details

  • Orange Wave 1 Activity: Marks the initiation of a new bearish phase within the larger context of Navy Blue Wave 3.

  • Wave 1 Implications: Within Elliott Wave theory, wave 1 indicates the beginning of a fresh trend, affirming bearish momentum.
  • Navy Blue Wave 3: Represents a dominant bearish force, as wave 3 often characterizes the most aggressive phase of a trend.
  • Bearish Sentiment: Signals further potential declines for AUDJPY as orange wave 1 progresses, suggesting short-term downside movement.

Invalidation Level and Trading Implications

The invalidation level for this wave structure is set at 102.424. A price movement above this level would:

  • Suggest a potential trend reversal or reduced bearish momentum.
  • Require traders to reassess the wave structure and adapt their trading strategies.

This level serves as a pivotal point for validating the ongoing bearish trend and gauging its strength.

Conclusion

The 4-hour chart analysis of AUDJPY reinforces a bearish outlook. The continuation of orange wave 1 within navy blue wave 3 underscores the likelihood of further downward movement. However, the invalidation level at 102.424 is a critical juncture. If breached, it would challenge the bearish structure and potentially signal a reversal in market direction.

Technical Analyst: Malik Awais

Source: visit Tradinglounge.com and learn From the Experts Join TradingLounge Here 

Previous: EURUSD Elliott Wave Technical Analysis

VALUE Offer - Buy 1 Month & Get 3 Months!Click here

Access 7 Analysts Over 200 Markets Covered. Chat Room With Support

AUDJPY-4h-Forex-Char...

Related

Unlocking ASX Trading Success: Santos Limited (STO) Stock Analysis & Elliott Wave Technical Forecast

Unlocking ASX Trading Success: Santos Limited (STO) Stock Analysis & Elliott Wave Technical Forecast

Dive into the ASX market with Santos Limited (STO) stock analysis and Elliott Wave forecast. Stay ah...

Read More >
USD/CAD Elliott Wave Analysis: Trading Insights on 4-Hour and Daily Charts - 9 February 24

USD/CAD Elliott Wave Analysis: Trading Insights on 4-Hour and Daily Charts - 9 February 24

Dated 9 February 24, our "USD/CAD Elliott Wave Analysis Trading Lounge 4 Hour Chart" sugge...

Read More >
Unlocking ASX Trading Success: ANZ GROUP HOLDINGS LIMITED - ANZ Elliott Wave Analysis & Elliott Wave Technical Forecast

Unlocking ASX Trading Success: ANZ GROUP HOLDINGS LIMITED - ANZ Elliott Wave Analysis & Elliott Wave Technical Forecast

This in-depth Elliott Wave analysis focuses on ASX: ANZ GROUP HOLDINGS LIMITED, highlighting key tec...

Read More >
S&P 500 ELLIOTT WAVE ANALYSIS, 23 FEB 2022

S&P 500 ELLIOTT WAVE ANALYSIS, 23 FEB 2022

SP500 The Feds rise in rates to control inflation are placing more pressure on the markets. Plus the...

Read More >
S&P/TSX 60 Elliott Wave Analysis: Orange Wave 4 Corrective Phase, Wave Predictions, Bullish Trends, and Market Insights

S&P/TSX 60 Elliott Wave Analysis: Orange Wave 4 Corrective Phase, Wave Predictions, Bullish Trends, and Market Insights

Gain valuable insights into the S&P/TSX 60 Index with a thorough Elliott Wave analysis. Explore the ...

Read More >
Mastering Apple Stock: Your Guide to Trading AAPL with Elliott Wave Technical Analysis

Mastering Apple Stock: Your Guide to Trading AAPL with Elliott Wave Technical Analysis

This detailed guide provides an in-depth Elliott Wave analysis of Apple Inc (AAPL) for 2024, offerin...

Read More >

$1 for 2 Weeks

then $29 a month!

What a Special Offer!

Trade Recommendations

Unleash the power of deversified trading with our comprehensive portfolio, covering 250+ markets:

  • Stock Trades
  • Crypto Trades
  • Forex Trades
  • Commodity Trades
Elliott Wave Analysis

Gain a competitive edge with expert insights and AI-powered Elliott Wave charting into:

  • Global Indices
  • US Stocks & ASX Stocks
  • Forex & Crypto
  • Commodities
Top-Notch Trading Tools

Equip yourself with the tools of success:

  • Real-time Chat rooms
  • Elliott Wave Algorithm
  • Portfolio tools
  • TradingLevels
  • Screener
  • Trading Game
7 Elliott Wave Analysts

Stay ahead of the market with daily charts and insightful videos
Your secret to strategic trading!

JOIN HERE


Welcome to TradingLounge (ASIC A.R.No. 321187), specialists in trades, trading education and technical analysis, covering stocks, indices, commodities, forex and cryptocurrencies.

When you join TradingLounge you have access to everything we offer, including trade tools, educational content and a social platform to chat with like-minded investors.

Read more

@Copyright 2024 by tradinglounge.com

Contact Us

Australian no: 02 4787 6020

International no: +61 (2) 47876020

Pay with:

Find us on