TradingLounge Iron Ore (SGX TSI Index Futures) Elliott Wave Analysis

SGX TSI Iron Ore Index Elliott Wave Analysis

Iron Ore Elliott Wave Technical Analysis

The SGX TSI Iron Ore Index serves as a vital benchmark in the iron ore market, providing essential insights for traders, miners, and steelmakers involved in contract settlements and managing price risks. This index is grounded in actual transactions within the iron ore spot market, making it a reliable indicator of market trends.

The index reached a historic peak of around $233 per dry metric ton in May 2021, fueled by robust demand from China and supply disruptions among key producers. However, this high signaled the onset of a significant correction, with the index plunging by over 68% to $73 by October 2022. A recovery phase ensued, elevating the index to $143.5 by December 2023. Despite a strong rebound in April and May 2024, the index has since reversed direction, continuing the downtrend that began in January 2024.

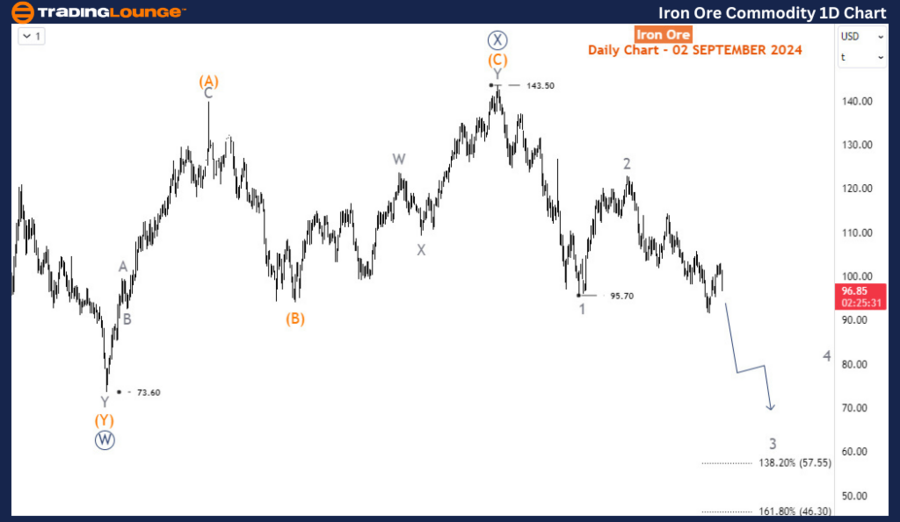
Long-Term Elliott Wave Analysis

In May 2021, the SGX TSI Iron Ore Index entered a bearish corrective phase, forming a primary W-X-Y wave pattern at the primary degree. The initial leg, wave W (circled), completed at the October 2022 low, followed by wave X (circled) which peaked at the January 2024 high of $143.5. The current wave Y (circled) began at this January 2024 peak and is expected to unfold into a 3-wave structure, comprising intermediate degree waves (A)-(B)-(C).

At present, the index is developing wave 3 of (A), which could potentially drive the price down to $45, indicating a bearish long-term outlook. This wave structure suggests that the overall trend remains negative, with additional downside anticipated as wave Y completes its formation.

Iron-Ore-Commodity-1...


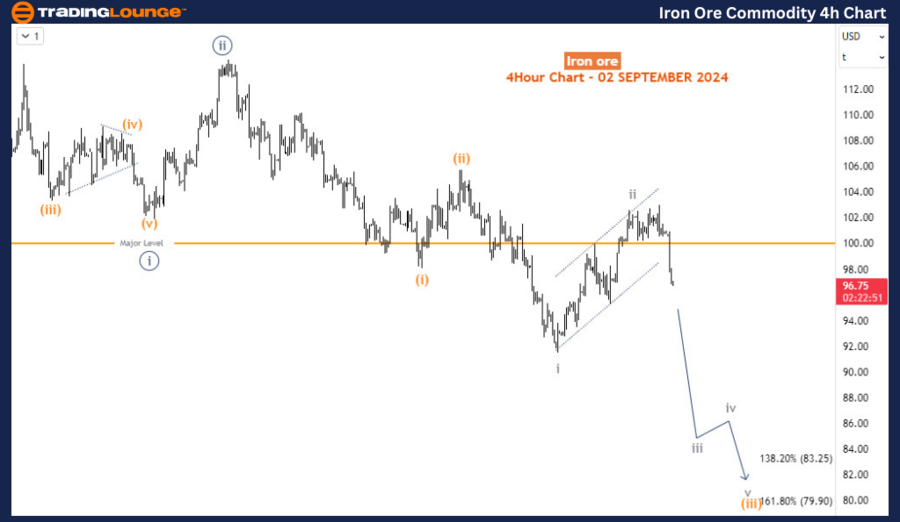
Iron Ore H4 Chart Analysis

Focusing on the H4 chart, wave 3 commenced at $122.9 and is currently advancing through its 3rd sub-wave, wave iii (circled) of 3. Within this framework, the price is progressing through wave (iii) of iii (circled) of 3. Short-term projections indicate that wave (iii) could push the index down to $85 before experiencing a corrective bounce in wave (iv). After this brief retracement, the downward trend is expected to resume, consistent with the broader bearish outlook indicated by the long-term Elliott Wave structure.

Technical Analyst: Sanmi Adeagbo

Source: visit Tradinglounge.com and learn From the Experts Join TradingLounge Here 

See Previous: Gold Elliott Wave Technical Analysis

Special Trial Offer - 0.76 Cents a Day for 3 Months! Click here

Access 7 Analysts Over 200 Markets Covered. Chat Room With Support

Iron-Ore-Commodity-4...

Related

Stay Informed on Commodity Market: GX Uranium ETF (URA) Elliott Wave Technical Analysis

Stay Informed on Commodity Market: GX Uranium ETF (URA) Elliott Wave Technical Analysis

The Global X Uranium ETF (GX URA) offers investors a diversified portfolio of companies engaged in u...

Read More >
Dogecoin Crypto Price and DOGEUSD Elliott Wave Analysis: Technical Indicators that Point to Upcoming Market Moves

Dogecoin Crypto Price and DOGEUSD Elliott Wave Analysis: Technical Indicators that Point to Upcoming Market Moves

Get the latest on Dogecoin (DOGEUSD) with comprehensive Elliott Wave analysis and expert trading str...

Read More >
Natural Gas Commodity Forecast: NG Elliott Wave Technical Analysis Predicts Bullish Rally | Rebounding Strongly Since April

Natural Gas Commodity Forecast: NG Elliott Wave Technical Analysis Predicts Bullish Rally | Rebounding Strongly Since April

Natural Gas has been rebounding strongly since April. Elliott Wave analysis shows a potential bullis...

Read More >
Comprehensive Insights on ASX LIMITED - ASX Stock Analysis & Elliott Wave Technical Forecast

Comprehensive Insights on ASX LIMITED - ASX Stock Analysis & Elliott Wave Technical Forecast

Stay updated with comprehensive insights on ASX Limited stock. Explore the current stock price, deta...

Read More >
The Home Depot (HD) Elliott Wave Analysis: Stock Forecast, Technical Insights and Market Trends for Smart Trading Strategies

The Home Depot (HD) Elliott Wave Analysis: Stock Forecast, Technical Insights and Market Trends for Smart Trading Strategies

The Home Depot (HD) Elliott Wave analysis, providing a detailed stock forecast and technical breakdo...

Read More >

Buy 1 Month

Get 3 Months!

Special Offer:

Trade Recommendations

Unleash the power of deversified trading with our comprehensive portfolio, covering:

  • Stock Trades
  • Crypto Trades
  • Forex Trades
  • Commodity Trades
Elliott Wave Analysis

Gain a competive edge with expert insights in to:

  • Global Indices
  • US Stocks & ASX Stocks
  • Forex & Crypto
  • Commodities
Top-Notch Trading Tools

Equip yourself with the tools of success:

  • Social Chat
  • Elliott Wave Algorithm
  • Screener
  • TradingLevels
  • Trading Game
7 Elliott Wave Analysts

Stay ahead of the market with daily charts and insightful videos
-Your secret to strategic trading!

JOIN HERE


Welcome to TradingLounge (ASIC A.R.No. 321187), specialists in trades, trading education and technical analysis, covering stocks, indices, commodities, forex and cryptocurrencies.

When you join TradingLounge you have access to everything we offer, including trade tools, educational content and a social platform to chat with like-minded investors.

Read more

@Copyright 2024 by tradinglounge.com

Contact Us

Australian no: 02 4787 6020

International no: +61 (2) 47876020

Pay with:

Find us on