29Apr

Insurance Australia Group (ASX:IAG) Elliott Wave Forecast: Chart Analysis, Price Targets, Resistance Levels & Trading Strategy

ASX: INSURANCE AUSTRALIA GROUP LIMITED – IAG Elliott Wave Technical Analysis by TradingLounge (1D Chart)

Greetings,
This update provides the latest Elliott Wave analysis for Insurance Australia Group Limited (ASX:IAG). The stock is currently approaching the end of a corrective B-grey wave, indicating a potential decline ahead. As there is no confirmation of a bullish reversal, long positions remain high-risk at this point in the cycle.

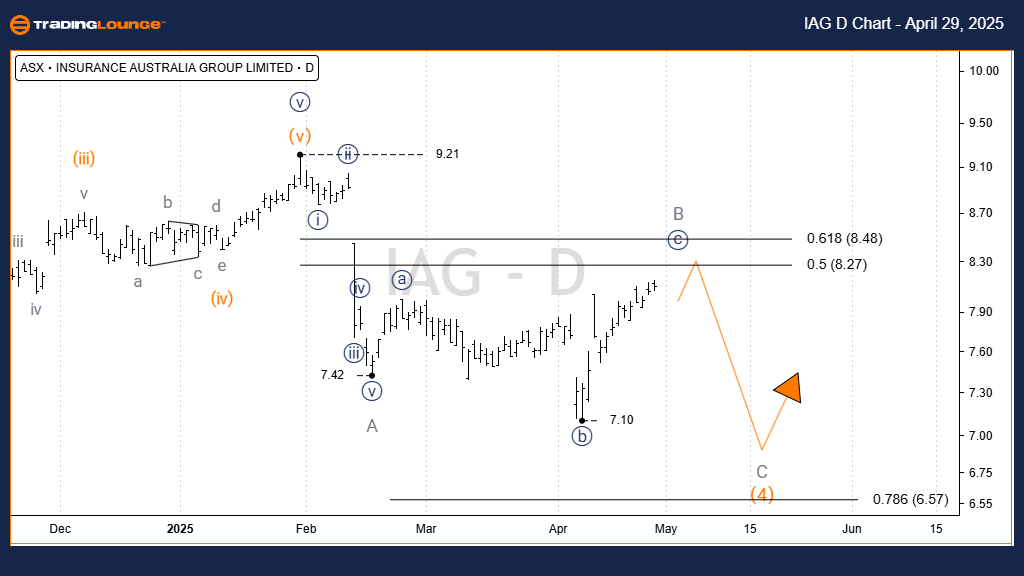
ASX: INSURANCE AUSTRALIA GROUP LIMITED – IAG 1D Chart (Semilog Scale) Analysis

Function: Major Trend (Minor Degree, Grey)

Mode: Motive

Structure: Impulse

Position: Wave c))-navy of Wave B-grey

Details: Wave 3)-orange has completed as a classic five-wave impulse. Wave 4)-orange is now retracing lower in a Zigzag pattern labeled A, B, C-grey.

  • Wave A-grey is finalized.
  • Wave B-grey is forming an Expanded Flat, with wave c))-navy expected to target the 8.27–8.48 range.

Invalidation Point: The completion of wave b))-navy.

IAG-Asx-Stock-day-ch...


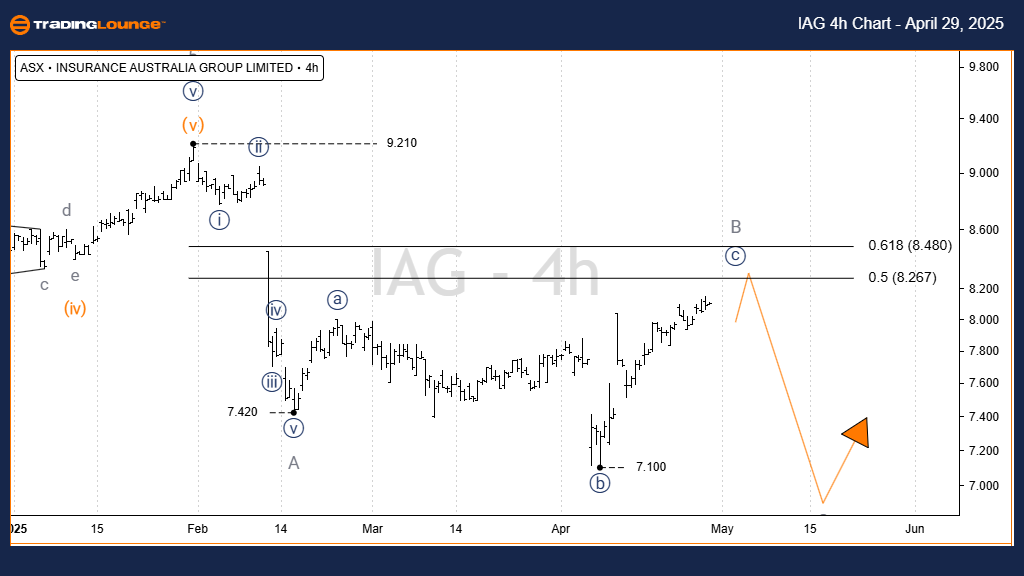
ASX: INSURANCE AUSTRALIA GROUP LIMITED – IAG 4-Hour Chart Analysis

Function: Major Trend (Minor Degree, Grey)

Mode: Motive

Structure: Impulse

Position: Wave c))-navy of Wave B-grey

Details:
Zooming into the 4H chart, from the 7.420 low, wave B-grey has been evolving as an Expanded Flat—highlighting weak directional strength.

  • Wave b))-navy is more complex than wave a))-navy.
  • Wave c))-navy is now advancing with stronger momentum, typical of Flat patterns.
  • Resistance is expected between 8.267–8.480 before wave B-grey ends and wave C-grey begins its downward path.

Invalidation Point: 7.100

Technical Analyst: Hua (Shane) Cuong, CEWA-M (Master’s Designation).

Source: Visit Tradinglounge.com and learn from the Experts. Join TradingLounge Here 

See Previous: BLOCK, INC Elliott Wave Technical Analysis

VALUE Offer - Buy 1 Month & Get 3 Months!Click here

Access 7 Analysts Over 200 Markets Covered. Chat Room With Support

IAG-Asx-Stock-4h-cha...


Conclusion
This ASX:IAG Elliott Wave forecast outlines the current corrective phase and potential downside risk for Insurance Australia Group Limited. Traders should remain cautious as price nears key resistance. Our technical analysis highlights pivotal levels that validate or invalidate the wave count, helping refine strategic entry and exit points.
TradingLounge remains committed to delivering expert Elliott Wave insights and accurate trend analysis for active traders on the ASX.

Related

The Walt Disney Company (DIS) Elliott Wave Technical Analysis: Unveiling Market Trends

The Walt Disney Company (DIS) Elliott Wave Technical Analysis: Unveiling Market Trends

Gain valuable insights into The Walt Disney Company's (DIS) market trends with our expert DIS El...

Read More >
Riding the Uptrend: ChainLink/U.S. Dollar (LINKUSD) Elliott Waves Technical Analysis by Expert

Riding the Uptrend: ChainLink/U.S. Dollar (LINKUSD) Elliott Waves Technical Analysis by Expert

Discover the keys to unlocking profitable trades in the ChainLink/USD (LINKUSD) market with expert i...

Read More >
Australian Dollar/U.S.Dollar (AUDUSD) Forex Elliott Wave Technical Analysis: In-depth Trading Lounge Chart Overview

Australian Dollar/U.S.Dollar (AUDUSD) Forex Elliott Wave Technical Analysis: In-depth Trading Lounge Chart Overview

This article provides an in-depth Elliott Wave analysis of the AUDUSD pair, featuring key insights i...

Read More >
Predicting the Breakout Direction: Gold (XAUUSD) Elliott Wave Technical Analysis

Predicting the Breakout Direction: Gold (XAUUSD) Elliott Wave Technical Analysis

while gold remains trapped in a range for now, the anticipation of a breakout looms large. With care...

Read More >
Polkadot Crypto Price News Today Elliott Wave Technical Analysis of Polkadot (DOT/USD): Comprehensive Guide

Polkadot Crypto Price News Today Elliott Wave Technical Analysis of Polkadot (DOT/USD): Comprehensive Guide

This article provides an in-depth Elliott Wave analysis of Polkadot (DOT/USD), offering insights int...

Read More >
British Pound/ U.S. Dollar Forex Pair and GBPUSD Elliott Wave Technical Analysis: Daily and 4H Chart for Trading Setup Opportunities

British Pound/ U.S. Dollar Forex Pair and GBPUSD Elliott Wave Technical Analysis: Daily and 4H Chart for Trading Setup Opportunities

The GBPUSD daily and 4-hour charts show a counter-trend Wave 2 correction within a broader bearish E...

Read More >

$1 for 2 Weeks

then $29 a month!

What a Special Offer!

Trade Recommendations

Unleash the power of deversified trading with our comprehensive portfolio, covering 250+ markets:

  • Stock Trades
  • Crypto Trades
  • Forex Trades
  • Commodity Trades
Elliott Wave Analysis

Gain a competitive edge with expert insights and AI-powered Elliott Wave charting into:

  • Global Indices
  • US Stocks & ASX Stocks
  • Forex & Crypto
  • Commodities
Top-Notch Trading Tools

Equip yourself with the tools of success:

  • Real-time Chat rooms
  • Elliott Wave Algorithm
  • Portfolio tools
  • TradingLevels
  • Screener
  • Trading Game
7 Elliott Wave Analysts

Stay ahead of the market with daily charts and insightful videos
Your secret to strategic trading!

JOIN HERE


Welcome to TradingLounge (ASIC A.R.No. 321187), specialists in trades, trading education and technical analysis, covering stocks, indices, commodities, forex and cryptocurrencies.

When you join TradingLounge you have access to everything we offer, including trade tools, educational content and a social platform to chat with like-minded investors.

Read more

@Copyright 2024 by tradinglounge.com

Contact Us

Australian no: 02 4787 6020

International no: +61 (2) 47876020

Pay with:

Find us on