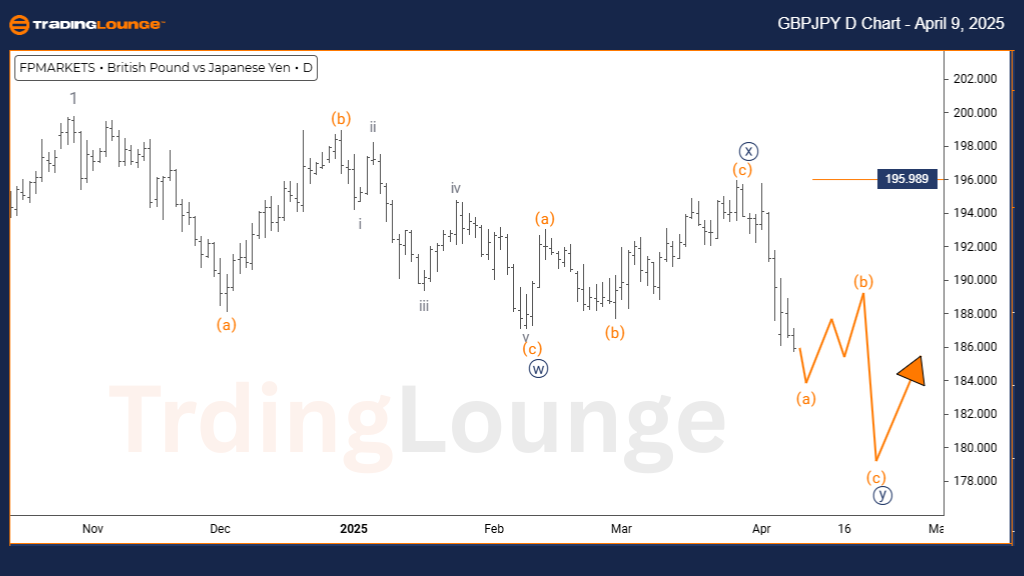
British Pound/Japanese Yen (GBPJPY) Elliott Wave Forecast – TradingLounge Day Chart
GBPJPY Elliott Wave Technical Analysis
FUNCTION: Counter Trend
MODE: Corrective
STRUCTURE: Navy blue wave Y
POSITION: Gray wave 2
DIRECTION NEXT HIGHER DEGREES: Gray wave 3
DETAILS: Navy blue wave X is now considered complete, and orange wave Y of gray wave 2 is actively forming.
Wave Cancel Invalid Level: 195.998
The daily GBPJPY Elliott Wave analysis presents a defined counter-trend pattern for this forex pair, highlighting a corrective phase within a larger structure. Current attention is on navy blue wave Y, which fits within the broader gray wave 2. The completion of navy blue wave X suggests the market is now evolving into orange wave Y of gray wave 2. This phase implies a temporary deviation from the dominant trend before an anticipated continuation.
This daily timeframe view aids forex traders in pinpointing GBPJPY's location within the overall Elliott Wave sequence. As orange wave Y progresses inside gray wave 2, a critical invalidation level sits at 195.998. A breach above this would call the existing wave interpretation into question. Monitoring this threshold helps validate the structure's integrity and informs trading risk management.
The analysis emphasizes how wave degrees interact, identifying navy blue wave Y as both a mid-term trading setup and a structural element of gray wave 2. Forex traders should remain alert for traditional corrective signs, such as three-leg formations or sideways ranges—both typical of counter-trend movement. This scenario supports a cautious approach, waiting for structure completion confirmation before entering GBPJPY trades. The setup provides insight into both tactical decisions and strategic forex positioning.
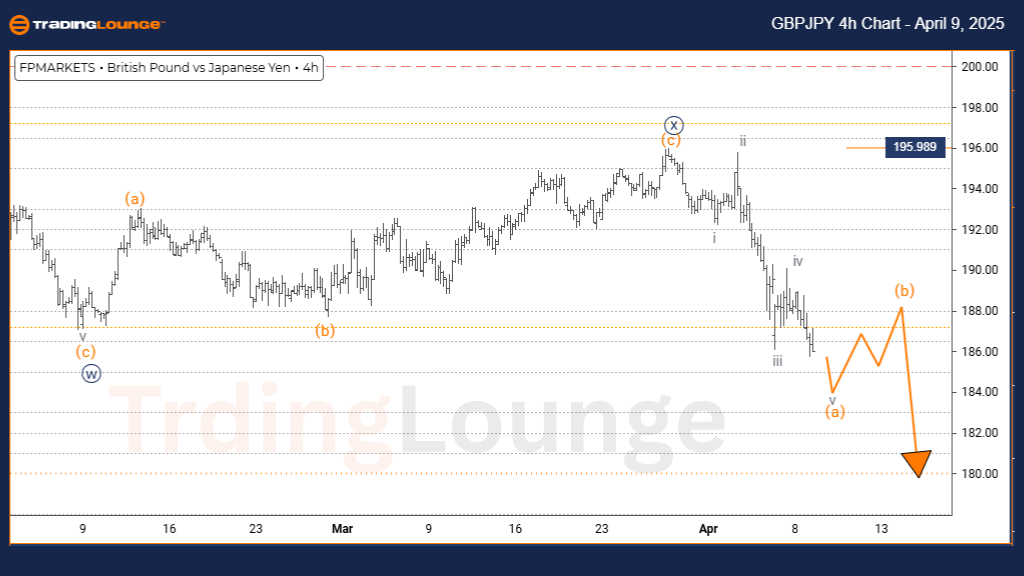
British Pound/Japanese Yen (GBPJPY) Elliott Wave Forecast – TradingLounge 4 Hour Chart
GBPJPY Elliott Wave Technical Analysis
FUNCTION: Counter Trend
MODE: Impulsive as A
STRUCTURE: Orange wave A
POSITION: Navy blue wave Y
DIRECTION NEXT HIGHER DEGREES: Orange wave B
DETAILS: Navy blue wave X has finalized, and orange wave A of Y is now progressing.
Wave Cancel Invalid Level: 195.998
The 4-hour GBPJPY Elliott Wave chart outlines a counter-trend analysis, showcasing a prominent corrective pattern in development. The current focal point is orange wave A, situated within the larger navy blue wave Y. With the completion of navy blue wave X, GBPJPY is now moving through the early stages of impulsive orange wave A, marking a possible shift in short-term market sentiment.
Forex traders should closely monitor the 195.998 invalidation level, a critical price point that, if surpassed, would contradict the current Elliott Wave perspective. The 4-hour analysis provides detailed insight into the impulsive structure's evolution, which fits into the larger corrective wave context. This early-stage impulsive move suggests increased directional strength, often seen at the start of corrective progressions.
This analysis reinforces the importance of understanding wave degrees and their alignment. Orange wave A serves as both a short-term trade opportunity and a component within navy blue wave Y. Market participants should look for impulsive movement characteristics, including firm price direction and momentum. The current structure suggests measured trading in GBPJPY, integrating both near-term analysis and broader forex strategies in line with Elliott Wave principles.
Technical Analyst: Malik Awais
Source: Visit Tradinglounge.com and learn from the Experts Join TradingLounge Here
Previous: GBPUSD Elliott Wave Technical Analysis
VALUE Offer - Buy 1 Month & Get 3 Months!Click here
Access 7 Analysts Over 200 Markets Covered. Chat Room With Support