British Pound/ U.S. Dollar (GBPUSD) Elliott Wave Analysis | Trading Lounge Daily Chart
GBPUSD Elliott Wave Technical Analysis
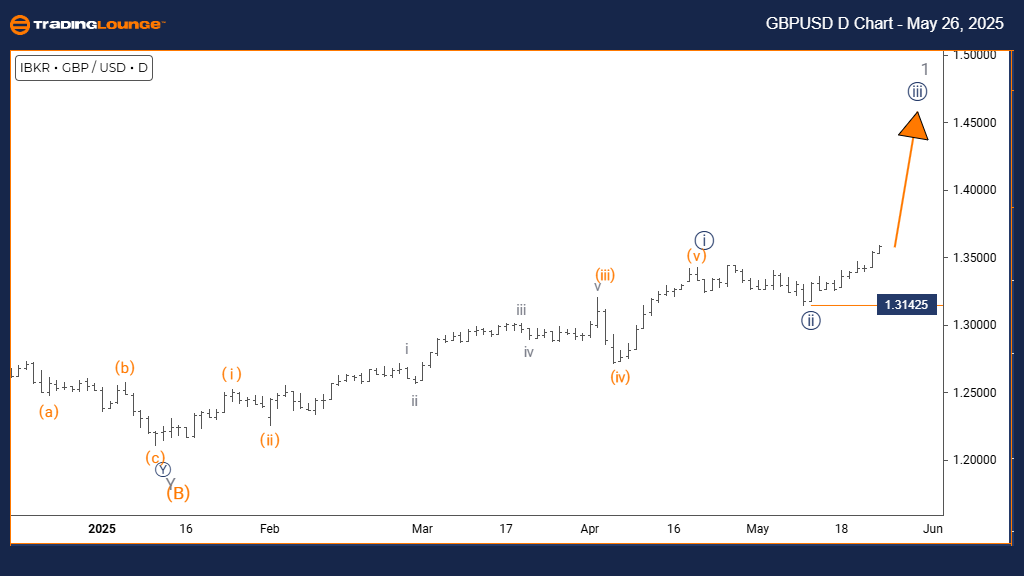
FUNCTION: Bullish Trend
MODE: Impulsive
STRUCTURE: Navy Blue Wave 3
POSITION: Gray Wave 1
DIRECTION NEXT HIGHER DEGREES: Navy Blue Wave 3 (Initiated)
DETAILS: Navy Blue Wave 2 has likely completed. Navy Blue Wave 3 is now developing.
Invalidation Level: 1.31425
The GBPUSD daily chart reveals a clear bullish Elliott Wave pattern, with impulsive behavior aligning with the unfolding navy blue wave 3. This phase is part of the initial gray wave 1, pointing to the end of the corrective navy blue wave 2 and the emergence of a strong upward trend. The current structure suggests GBPUSD has entered a high-momentum bullish phase, often associated with wave 3 dynamics.
Technical analysis confirms the conclusion of navy blue wave 2 and the active development of wave 3. The impulsive setup reflects strong institutional interest and momentum, indicating a favorable environment for further upside. The 1.31425 invalidation level serves as a critical risk benchmark—any drop below this level would challenge the current wave structure and suggest a need for reevaluation.
Traders should recognize that this phase typically represents the most lucrative segment of an Elliott Wave impulse pattern. As wave 3 unfolds, it's essential to monitor trend continuation signals and align trading strategies with risk controls. The long-term analysis supports a bullish GBPUSD outlook, maintaining 1.31425 as a pivotal reference point.
British Pound/ U.S. Dollar (GBPUSD) Elliott Wave Analysis | Trading Lounge 4-Hour Chart
GBPUSD Elliott Wave Technical Analysis
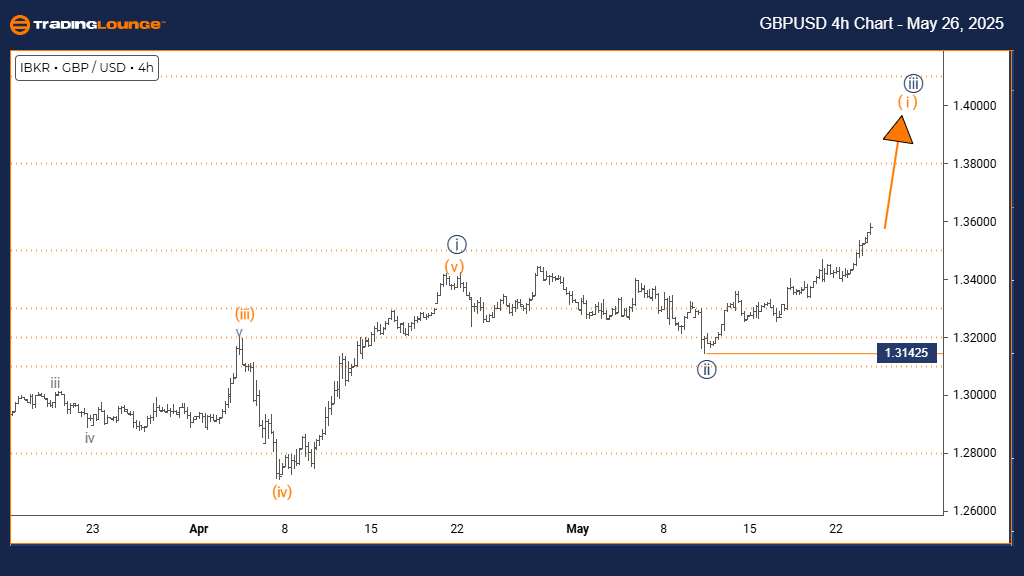
FUNCTION: Bullish Trend
MODE: Impulsive
STRUCTURE: Orange Wave 1
POSITION: Navy Blue Wave 3
DIRECTION NEXT LOWER DEGREES: Orange Wave 2
DETAILS: Navy Blue Wave 2 seems complete. Orange Wave 1 of 3 is now forming.
Invalidation Level: 1.31425
The GBPUSD 4-hour chart displays continued bullish energy as a fresh impulsive sequence takes shape. Orange wave 1 is forming within the broader structure of navy blue wave 3, signaling that navy blue wave 2's correction phase has ended. This development marks the start of a likely sustained rally phase for GBPUSD.
With the conclusion of navy blue wave 2 validated by the impulsive rise of orange wave 1, the market shows signs of increased buying pressure and positive momentum. The current structure supports short-term bullish opportunities, while keeping a close watch on the 1.31425 invalidation level, which, if breached, would negate the current wave projection.
For traders, this early impulsive stage—orange wave 1—can offer strategic entry points, especially ahead of the anticipated orange wave 2 correction. Observing for confirmation signals and implementing prudent risk management will be essential. Overall, the analysis suggests that GBPUSD is well-positioned for near-term bullish advancement, supported by a solid Elliott Wave foundation.
Technical Analyst: Malik Awais
Source: Visit Tradinglounge.com and learn from the Experts. Join TradingLounge Here
Previous: EURUSD Elliott Wave Technical Analysis
VALUE Offer - Buy 1 Month & Get 3 Months!Click here
Access 7 Analysts Over 200 Markets Covered. Chat Room With Support