Euro/ U.S. Dollar (EURUSD) Currency Pair – TradingLounge Day Chart
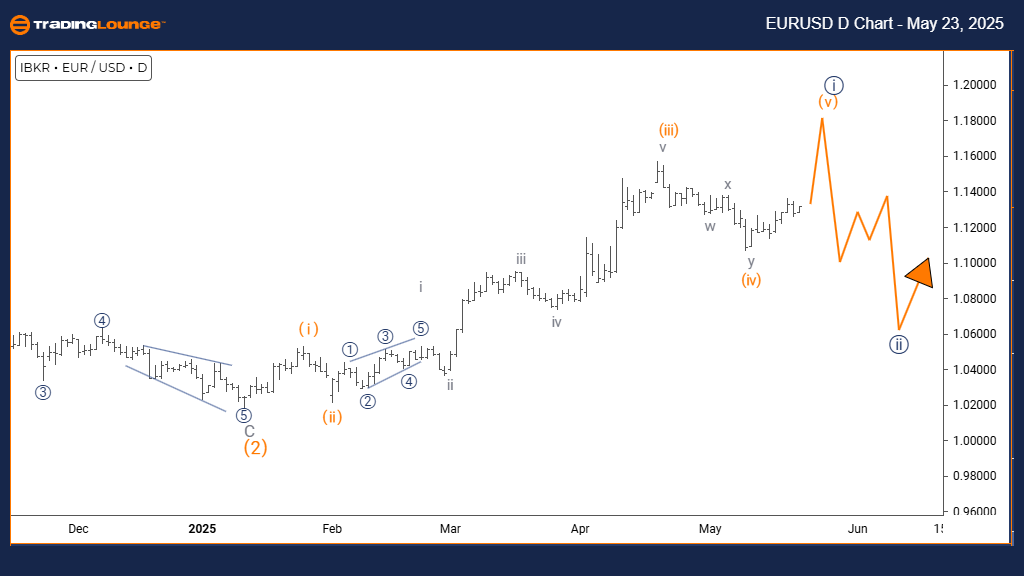
Euro/ U.S. Dollar (EURUSD) Day Chart Analysis
EURUSD Elliott Wave Technical Analysis
FUNCTION: Bullish Trend
MODE: Impulsive
STRUCTURE: Navy Blue Wave 1
POSITION: Gray Wave 1
DIRECTION NEXT LOWER DEGREES: Navy Blue Wave 2
DETAILS: Navy Blue Wave 1 within Gray Wave 1 remains active, marking the beginning of a new bullish cycle.
The daily chart analysis of EUR/USD presents a strong bullish outlook supported by Elliott Wave Theory. The pair is forming Navy Blue Wave 1 inside Gray Wave 1, confirming an emerging impulsive trend. This pattern indicates the EUR/USD currency pair has potentially entered a fresh bullish phase, aligning with rising market optimism.
Currently, EUR/USD is advancing in Navy Blue Wave 1 of Gray Wave 1, which represents the early stage of a bullish Elliott Wave cycle. This impulsive wave formation suggests growing buying momentum, hinting at a sustained uptrend. Such a wave structure generally indicates more than a short-lived move, possibly paving the way for a prolonged rally.
This forecast is critical for forex traders, as it signals the initiation of a likely extended bullish phase for EUR/USD. The development of Navy Blue Wave 1 emphasizes initial strength, while the subsequent Navy Blue Wave 2 is anticipated as the next corrective step. Monitoring this progression helps in aligning trading strategies with broader market trends.
Traders are encouraged to observe volume increases and momentum indicators to validate the ongoing impulsive pattern. Although the setup favors continued gains, caution is essential, as corrections often follow impulsive waves. Overall, the daily chart analysis underlines a bullish long-term outlook for the EUR/USD forex pair.
Euro/ U.S. Dollar (EURUSD) – TradingLounge 4 Hour Chart
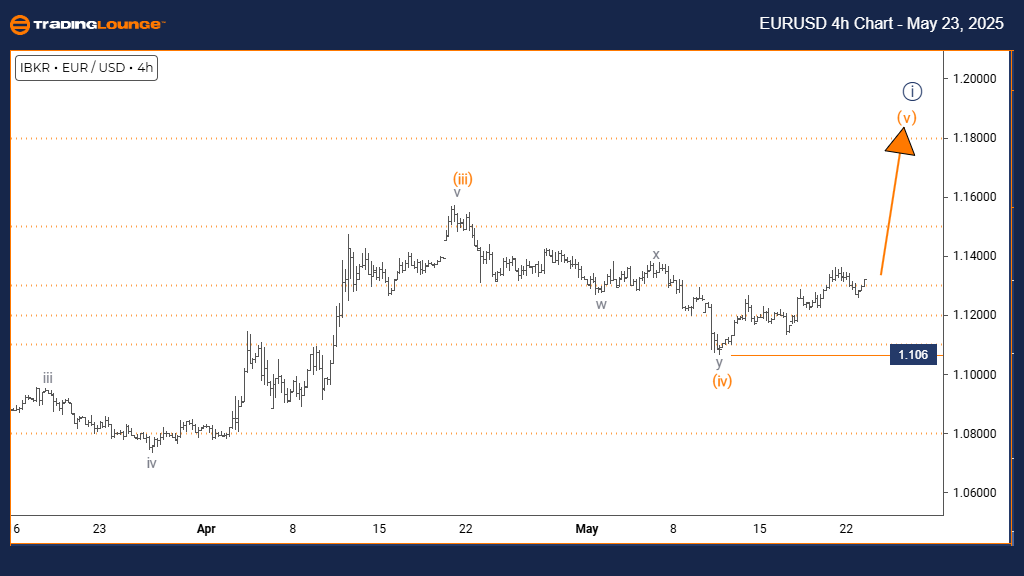
EURUSD Elliott Wave Technical Analysis
FUNCTION: Bullish Trend
MODE: Impulsive
STRUCTURE: Orange Wave 5
POSITION: Navy Blue Wave 1
DIRECTION NEXT HIGHER DEGREES: Orange Wave 5 (Active)
DETAILS: Orange Wave 4 has completed; Orange Wave 5 is in progress.
WAVE CANCEL INVALID LEVEL: 1.106
The 4-hour Elliott Wave analysis of EUR/USD confirms the pair is advancing within Orange Wave 5, completing the final leg of the current impulsive structure inside Navy Blue Wave 1. This scenario points to the pair approaching the peak of its bullish wave formation.
Following the completion of Orange Wave 4, the ongoing Orange Wave 5 suggests strong upward momentum. However, forex traders should remain alert to signs of weakening trend strength, typical in final impulse waves. The key invalidation level at 1.106 is critical—any move below it would challenge the current wave count and imply a possible trend reversal.
This analysis offers practical trading insights for managing positions during the concluding stage of the EUR/USD bullish cycle. The potential for additional gains remains, but it comes with increased risk as the trend matures. The 4-hour chart delivers a clear roadmap for identifying trade opportunities and adjusting risk management near the completion of a bullish impulse.
Technical Analyst: Malik Awais
Source: Visit Tradinglounge.com and learn from the Experts. Join TradingLounge Here
Previous: NZDUSD Elliott Wave Technical Analysis
VALUE Offer - Buy 1 Month & Get 3 Months!Click here
Access 7 Analysts Over 200 Markets Covered. Chat Room With Support