19Feb

Soybean Elliott Wave Analysis: Impulsive Trend Structure Points to Bearish Correction

SoyBean Elliott wave analysis - 19 February 24

Function - Trend

Mode - Impulsive

Structure - Impulse Wave

Position - Black Wave 5 of higher degree red wave (3)

Direction - Higher degree red wave (4)

Since the peak of the Russia-Ukraine conflict in 2022, SoyBean prices have remained subdued, trading at 1783 in June 2022 before plummeting to a three-year low of 1164 last week. The Elliott wave theory provides insights into the commodity's price action over the past three years, offering a structural pattern for analysis, forecasting, and trading.

On the daily timeframe, SoyBean appears to be undergoing a 3-wave correction denoted as blue wave A-B-C. Wave A concluded with a diagonal pattern, followed by a shallow bullish correction in wave B lasting just over 5 weeks. Subsequently, the decline in blue wave C continued impulsively. Preceding this decline was a 5-wave impulse rally labeled blue 1-2-3-4-5, a common occurrence in Elliott wave theory where a 3-wave counter-trend follows a 5-wave impulse move.

Currently, amid the third leg of the bearish correction (blue wave C), further downside is anticipated as wave C remains incomplete. However, even within a bearish correction, bullish moves can occur, as indicated by the potential development of red sub-wave (4) within blue wave C.

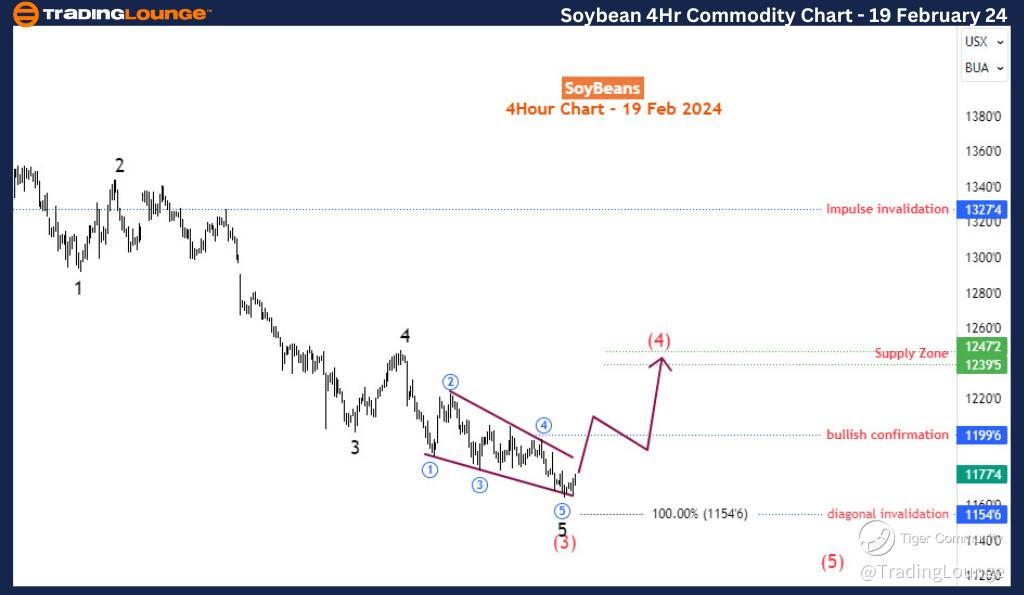
The 4-hour timeframe illustrates the development of sub-waves within blue wave C, with sub-wave (3) possibly concluding with an ending diagonal pattern and a gradual upward price reaction. A breakout above the diagonal's upper boundary would signal the onset of a red sub-wave (4), potentially leading to a bullish corrective rally towards the 1239-1263 supply zone. However, this rally may be limited to below 1260 before the broader bearish correction resumes with a red wave (5).

In summary, SoyBean may experience upward movement in the coming days or weeks, primarily corrective. Nonetheless, the overall outlook remains bearish.

Technical Analyst: Sanmi Adeagbo

Source: visit Tradinglounge.com and learn From the Experts Join TradingLounge Here 

See Previous: Wheat

SoyBean-Day-commodit...


SoyBean-4h-commodity...

Related

TASI Index Elliott Wave Analysis: Bullish Trend Forecast and Key Invalidation Level Insights

TASI Index Elliott Wave Analysis: Bullish Trend Forecast and Key Invalidation Level Insights

The TASI Index is currently in a strong bullish phase, as identified by Elliott Wave analysis. With ...

Read More >
Natural Gas Downtrend: Elliott Wave Technical Analysis and 2024 Market Forecast

Natural Gas Downtrend: Elliott Wave Technical Analysis and 2024 Market Forecast

This article provides an in-depth Natural Gas price analysis utilizing Elliott Wave Theory. It cover...

Read More >
U.S. Dollar / Swiss Franc (USDCHF) Elliott Wave Technical Analysis: Market Outlook & Trading Strategy for Forex Traders

U.S. Dollar / Swiss Franc (USDCHF) Elliott Wave Technical Analysis: Market Outlook & Trading Strategy for Forex Traders

USDCHF Elliott Wave analysis, covering the daily and 4-hour charts, explains the corrective wave str...

Read More >
KOSPI Composite Index Elliott Wave Technical Analysis: Understanding market behaviour and effective trading strategies

KOSPI Composite Index Elliott Wave Technical Analysis: Understanding market behaviour and effective trading strategies

The KOSPI Composite analysis provides insights using Elliott Wave Theory, detailing both day and wee...

Read More >
Understand the Bullish Correction Phase: Natural Gas Commodity Elliottwave Technical Analysis

Understand the Bullish Correction Phase: Natural Gas Commodity Elliottwave Technical Analysis

Discover comprehensive insights into the Natural Gas market with our 2024 price forecast. This analy...

Read More >
Microsoft Corp.(MSFT:NASDAQ) Elliott Wave Technical Analysis 16 October 23

Microsoft Corp.(MSFT:NASDAQ) Elliott Wave Technical Analysis 16 October 23

Microsoft Corp. Elliott Wave Technical Analysis with 1-hour and 4-hour charts for 16 October 23. Tra...

Read More >

Buy 1 Month

Get 3 Months!

Special Offer:

Trade Recommendations

Unleash the power of deversified trading with our comprehensive portfolio, covering:

  • Stock Trades
  • Crypto Trades
  • Forex Trades
  • Commodity Trades
Elliott Wave Analysis

Gain a competive edge with expert insights in to:

  • Global Indices
  • US Stocks & ASX Stocks
  • Forex & Crypto
  • Commodities
Top-Notch Trading Tools

Equip yourself with the tools of success:

  • Social Chat
  • Elliott Wave Algorithm
  • Screener
  • TradingLevels
  • Trading Game
7 Elliott Wave Analysts

Stay ahead of the market with daily charts and insightful videos
-Your secret to strategic trading!

JOIN HERE


Welcome to TradingLounge (ASIC A.R.No. 321187), specialists in trades, trading education and technical analysis, covering stocks, indices, commodities, forex and cryptocurrencies.

When you join TradingLounge you have access to everything we offer, including trade tools, educational content and a social platform to chat with like-minded investors.

Read more

@Copyright 2024 by tradinglounge.com

Contact Us

Australian no: 02 4787 6020

International no: +61 (2) 47876020

Pay with:

Find us on