Microsoft Corp., Elliott Wave Technical Analysis
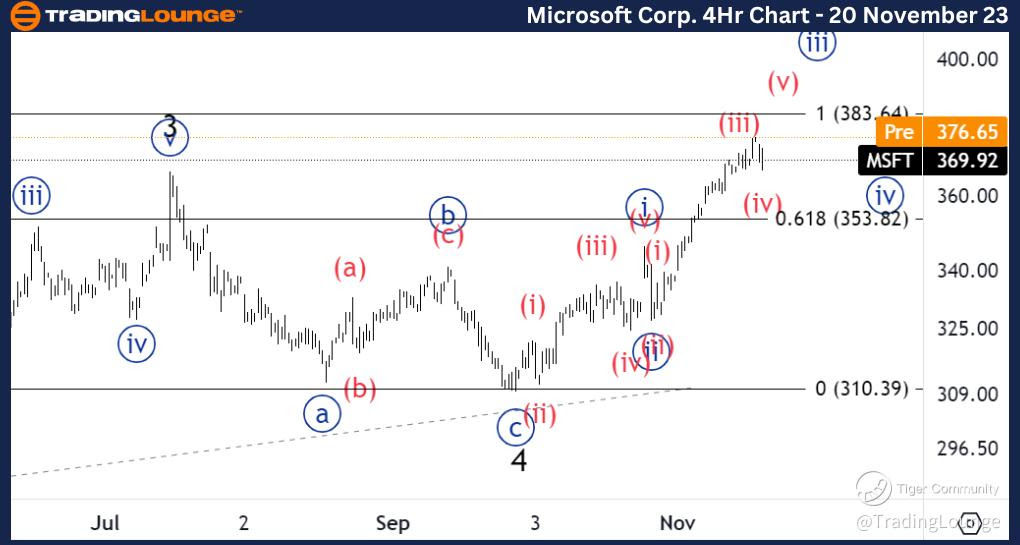
Microsoft Corp (MSFT:NASDAQ): 4h Chart, 20 November 23
MSFT Stock Market Analysis: We have been anticipating the up move into wave {iii} and we are now starting to look for a potential target. As we seem to be near completion of wave {iii}, 1.618 {iii} vs. {i} stands at 390 while equality of 5 vs 1 stands at 380$.
MSFT Elliott Wave Count: Wave (iv) of {iii}.
MSFT Technical Indicators: Above all averages.
MSFT Trading Strategy: Looking longs on the way into wave (v).
TradingLounge Analyst: Alessio Barretta
Source: Tradinglounge.com get trial here!
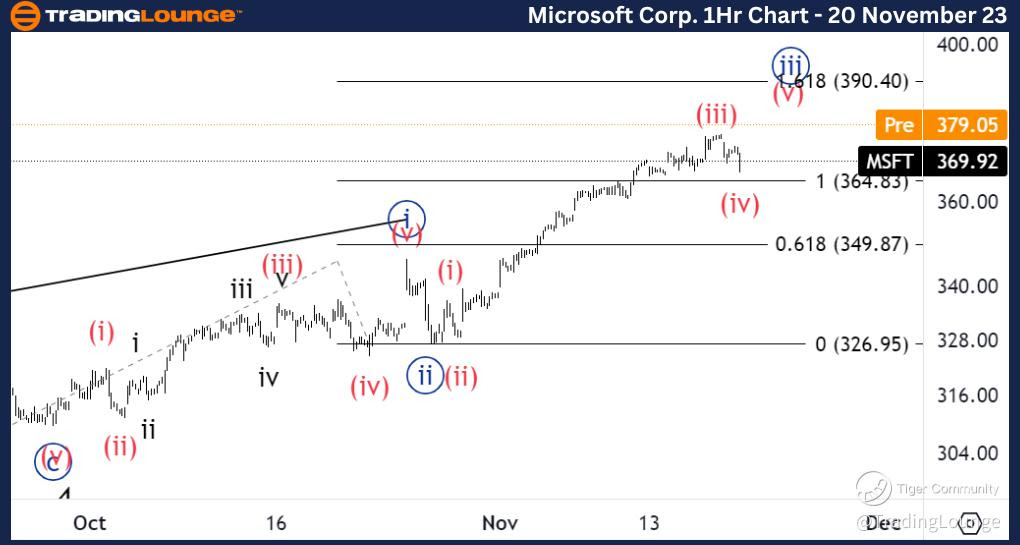
Microsoft Corp., MSFT: 1-hour Chart, 20 November 23
Microsoft Corp., Elliott Wave Technical Analysis
MSFT Stock Market Analysis: We seem to see a three wave move into wave (iv) being pretty sharp. Looking for resumption of the uptrend to also break 380$ and become successfully support to then target 400$.
MSFT Elliott Wave count: Wave c of (iv)
MSFT Technical Indicators: Support on the 20EMA.
MSFT Trading Strategy: Looking for longs into wave (v).