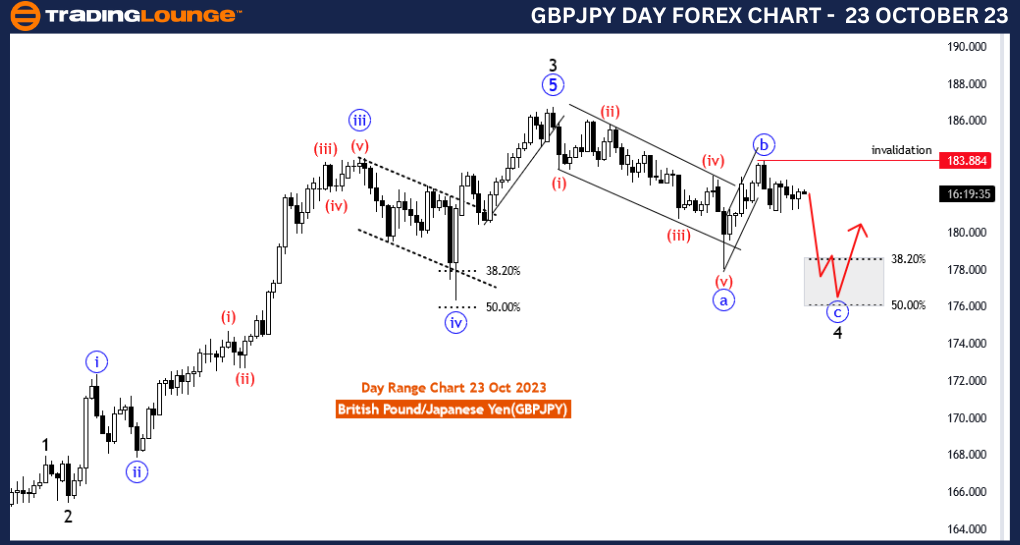
GBPJPY Elliott Wave Analysis Trading Lounge 4 Hour Chart, 23 October 23
British Pound/Japanese Yen(GBPJPY) 4 Hour Chart
GBPJPY Elliott Wave Technical Analysis
Function: Counter Trend
Mode: impulsive as blue wave C
Structure: blue wave C of black wave 4
Position: Black wave 4
Direction Next lower Degrees: wave C of 4 started
Details: Corrective wave B of 4 looking completed at 183.815 , now wave C of 4 started . Wave Cancel invalid level: 183.884
The GBPJPY Elliott Wave Analysis for the 4-hour chart on 23 October 23, offers a valuable perspective on the British Pound/Japanese Yen (GBPJPY) currency pair. It aids traders and investors in comprehending market movements and identifying critical phases in the ongoing trend.
The analysis categorizes the market function as "Counter Trend," suggesting that the current price movement is contrary to the primary trend. This is a significant piece of information, indicating a potential reversal or correction in the market.
Furthermore, the "impulsive" mode characterization indicates that the counter-trend move is strong and powerful. Such impulsive movements often lead to noteworthy price fluctuations, making them a focal point for traders seeking short- to medium-term trading opportunities.
The core of this analysis centers on "blue wave C of black wave 4," signifying a specific phase within the broader market structure. Understanding this wave pattern is crucial for traders looking for potential trend changes.
The report highlights that "Corrective wave B of 4 looking completed at 183.815," indicating the conclusion of a corrective phase. The transition from wave B to wave C is a critical point in the analysis, as it could signal a new impulsive movement in the opposite direction.
Of utmost significance is the "Wave Cancel invalid level: 183.884." This level serves as an essential reference point for traders. It helps determine when the described wave structure is invalidated, suggesting a change in market dynamics.
To summarize, the GBPJPY Elliott Wave Analysis for 23 October 23, provides significant insights into the GBPJPY currency pair. The transition from wave B to wave C is the focus of attention and traders should closely monitor the market for potential trading opportunities, taking into consideration the provided invalidation level to manage risk effectively.
Technical Analyst: Malik Awais
Source: Tradinglounge.com get trial here!
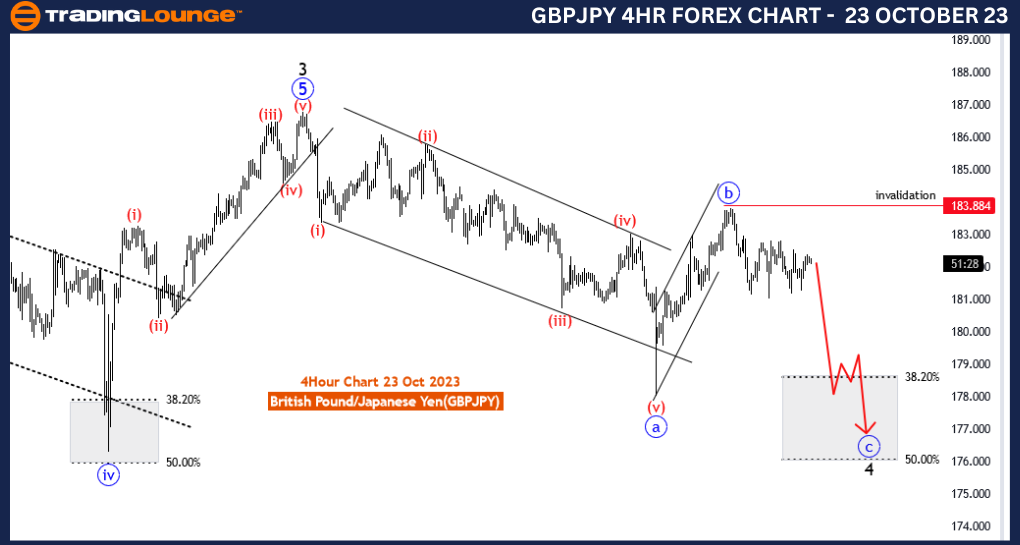
GBPJPY Elliott Wave Analysis Trading Lounge Day Chart, 23 October 23
British Pound/Japanese Yen(GBPJPY) Day Chart
GBPJPY Elliott Wave Technical Analysis
Function: Counter Trend
Mode: impulsive as blue wave C
Structure: blue wave C of black wave 4
Position: Black wave 4
Direction Higher lower Degrees: black wave 5
Details: Corrective wave B of 4 looking completed at 183.815 , now wave C of 4 started . Wave Cancel invalid level: 183.884
The GBPJPY Elliott Wave Analysis for the day chart on 23 October 23, is an essential tool for understanding the potential market dynamics of the British Pound/Japanese Yen (GBPJPY) currency pair. It provides valuable insights into the ongoing trend and potential trading opportunities.
The analysis characterizes the market function as "Counter Trend," indicating that the current price movement opposes the prevailing trend. This suggests a potential reversal or correction in the market, a crucial piece of information for traders.
The "impulsive" mode signifies that this counter-trend move is strong and powerful, possibly leading to substantial price movements. This makes it an area of interest for traders looking for short- to medium-term opportunities.
The core focus of the analysis is "blue wave C of black wave 4," highlighting a specific phase within the broader market structure. Understanding this wave pattern is vital for traders looking to identify potential trend changes.
The report mentions that "Corrective wave B of 4 appears to be completed at 183.815," indicating the conclusion of a corrective phase. The transition from wave B to wave C is a critical point in the analysis, as it could imply a new impulsive movement in the opposite direction.
The "Wave Cancel invalid level: 183.884" is of utmost importance. It serves as a crucial reference point for traders to determine when the described wave structure is invalidated, indicating a change in market dynamics.
In summary, the GBPJPY Elliott Wave Analysis for 23 October 23, provides significant insights into the GBPJPY currency pair. The transition from wave B to wave C is the key focal point. Traders should closely monitor the market for potential trading opportunities, while keeping a watchful eye on the provided invalidation level to manage risk effectively.
Technical Analyst: Malik Awais
Source: Tradinglounge.com get trial here!