NVIDIA Corporation (NVDA) is currently exhibiting strong upward trends, as indicated by the Elliott Wave Theory analysis on both daily and 4-hour charts. This technical analysis aims to provide traders with insights into the likely future movements of NVDA stock, helping them make informed trading decisions.

NVDA Elliott Wave Analysis Trading Lounge Daily Chart

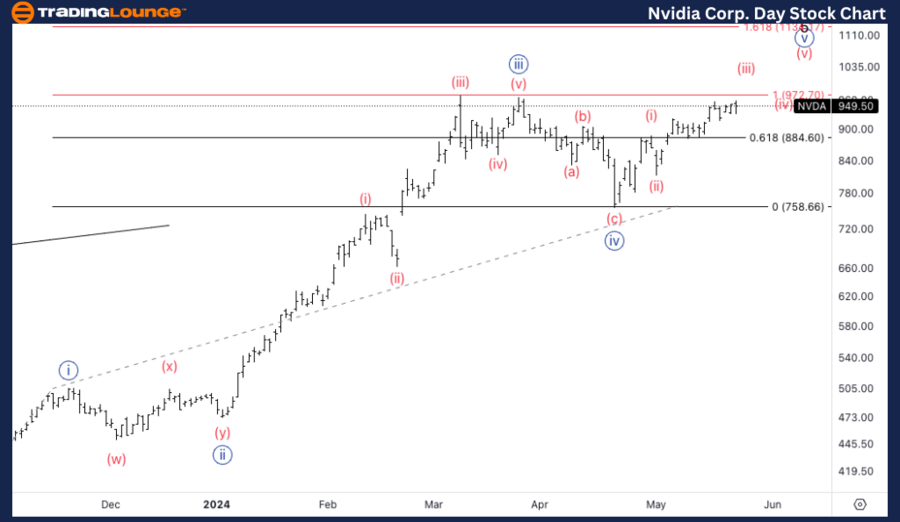
NVIDIA Corp. (NVDA) Daily Chart Analysis

NVDA Elliott Wave Technical Analysis

Function: Trend

Mode: Impulsive

Structure: Motive

Position: Minute {v}

Direction: Upside in {v} of 1

Details: The equality of {v} versus {i} is projected at $972, with resistance anticipated near the top of TL1 at $1000.

On the daily chart, NVDA is in an impulsive mode within a motive structure. This structure is currently positioned at Minute wave {v}, moving upwards in wave {v} of 1. The equality of wave {v} compared to wave {i} stands at $972. Traders should be vigilant as resistance is anticipated at the top of TL1 around $1000. This critical level could serve as a significant barrier, potentially causing a retracement or consolidation.

Nvidia-Corp-Daily-st...


NVDA Elliott Wave Analysis Trading Lounge 4Hr Chart

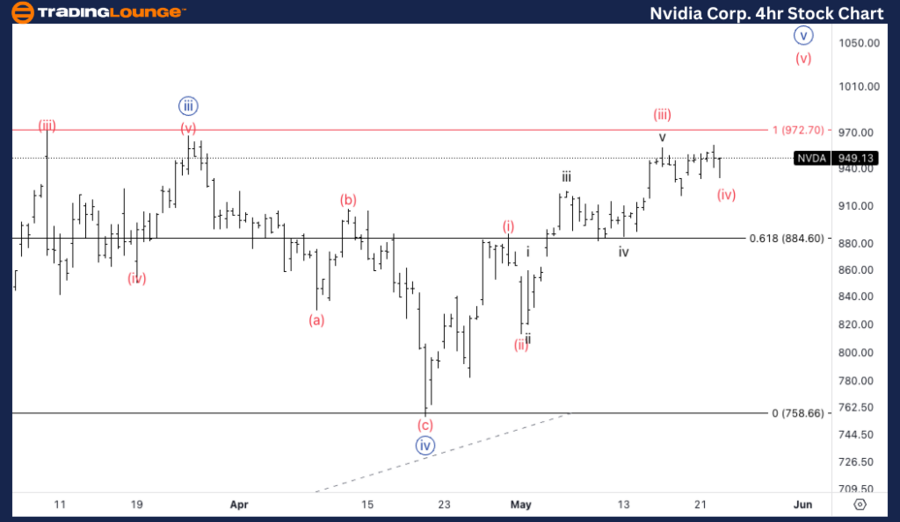
NVIDIA Corp. (NVDA) 4Hr Chart Analysis

NVDA Elliott Wave Technical Analysis

Function: Trend

Mode: Impulsive

Structure: Motive

Position: Wave (v) of {v}

Direction: Upside in (v)

Details: The current pattern suggests a bullish correction, indicating a likely further upside. Resistance is expected on the next upward move within potential wave (v).

The 4-hour chart further supports the daily analysis with a similar impulsive mode within a motive structure. NVDA is positioned in wave (v) of {v}, showing an upward movement in wave (v). The bullish correction indicates a continuation of the upward trend, suggesting further gains. Traders should watch for resistance in the upcoming wave (v), which could mark a crucial turning point.

Technical Analyst: Malik Awais

Source: visit Tradinglounge.com and learn From the Experts Join TradingLounge Here 

See Previous: Spotify Technology S.A., (SPOT) Stocks Elliott Wave Technical Analysis

Special Trial Offer - 0.76 Cents a Day for 3 Months! Click here

Access 7 Analysts Over 170 Markets Covered. Chat Room With Support

Nvidia-Corp-4Hr-stoc...

Conclusion

The NVDA Elliott Wave Analysis provides a comprehensive view of the stock's current and potential future movements. By understanding the trend functions, impulsive modes, and motive structures, traders can better navigate the market and make strategic decisions. With resistance levels identified, traders have clear markers to watch for potential breakouts or reversals. This analysis underscores the importance of combining technical analysis with strategic trading plans to optimize performance in the stock market.


Related

 Commonwealth Bank of Australia stock on the ASX: CBA Stock Analysis & Elliott Wave Technical Forecast

Commonwealth Bank of Australia stock on the ASX: CBA Stock Analysis & Elliott Wave Technical Forecast

This article comprehensively analyses Commonwealth Bank of Australia (CBA) stock on the ASX, utilizi...

Read More >
Eli Lilly & Co.(LLY:NYSE) Elliott Wave Technical Analysis 28 November 23

Eli Lilly & Co.(LLY:NYSE) Elliott Wave Technical Analysis 28 November 23

Eli Lilly & Co.(LLY:NYSE) Elliott Wave Technical Analysis dated 28 November 23 with 1-hour and 4-hou...

Read More >
U.S.Dollar/Japanese Yen (USDJPY) Elliott Wave Technical Analysis 18 December 23

U.S.Dollar/Japanese Yen (USDJPY) Elliott Wave Technical Analysis 18 December 23

USDJPY Elliott Wave Analysis Trading Lounge Day and 4-Hour Chart dated 18 December 23, delves into t...

Read More >
NEOUSD Elliott Wave Analysis: NEO Trading Strategy, Fibonacci Support Forecast, and Crypto Market Trends for Smart Traders

NEOUSD Elliott Wave Analysis: NEO Trading Strategy, Fibonacci Support Forecast, and Crypto Market Trends for Smart Traders

NEOUSD Elliott Wave analysis, Fibonacci support levels, and swing trading strategies to forecast pri...

Read More >
Optimize Your Asx Trading Strategies: RESMED INC - RMD Stock Analysis & Elliott Wave Technical Forecast

Optimize Your Asx Trading Strategies: RESMED INC - RMD Stock Analysis & Elliott Wave Technical Forecast

This article provides a comprehensive Elliott Wave analysis of ASX: ResMed Inc (RMD), offering insig...

Read More >
Ripple Xrp Crypto Price News Today Elliott Wave Technical Analysis: Ripple XRP's Forecast and Price Movements

Ripple Xrp Crypto Price News Today Elliott Wave Technical Analysis: Ripple XRP's Forecast and Price Movements

This comprehensive guide covers XRP price prediction, technical analysis, and Elliott Wave insights....

Read More >

$1 for 2 Weeks

then $29 a month!

What a Special Offer!

Trade Recommendations

Unleash the power of deversified trading with our comprehensive portfolio, covering 250+ markets:

  • Stock Trades
  • Crypto Trades
  • Forex Trades
  • Commodity Trades
Elliott Wave Analysis

Gain a competitive edge with expert insights and AI-powered Elliott Wave charting into:

  • Global Indices
  • US Stocks & ASX Stocks
  • Forex & Crypto
  • Commodities
Top-Notch Trading Tools

Equip yourself with the tools of success:

  • Real-time Chat rooms
  • Elliott Wave Algorithm
  • Portfolio tools
  • TradingLevels
  • Screener
  • Trading Game
7 Elliott Wave Analysts

Stay ahead of the market with daily charts and insightful videos
Your secret to strategic trading!

JOIN HERE


Welcome to TradingLounge (ASIC A.R.No. 321187), specialists in trades, trading education and technical analysis, covering stocks, indices, commodities, forex and cryptocurrencies.

When you join TradingLounge you have access to everything we offer, including trade tools, educational content and a social platform to chat with like-minded investors.

Read more

@Copyright 2024 by tradinglounge.com

Contact Us

Australian no: 02 4787 6020

International no: +61 (2) 47876020

Pay with:

Find us on