Gold (XAUUSD) Elliott Wave Analysis: Understanding the Current Pullback

Function: Trend

Mode: Impulse

Structure: Impulse Wave

Position: Wave A of (4)

Direction: Wave A of (4) is ongoing

Detailed Analysis:

Gold Elliott Wave Technical Analysis

1st Scenario: The current dip in Gold is likely to continue as part of wave (4) in a zigzag structure.

2nd Scenario: Wave 4 might evolve into an expanding flat, dipping below the current wave 4 low. Should a bullish impulse follow this bearish move below the wave 4 low, this scenario gains favor. The 1st scenario will be preferred if the next rally is corrective. The 1st scenario predicts a lower price than the 2nd.

Gold is in a pullback phase from a fresh all-time high. However, the long-term bullish cycle remains intact. This suggests that buyers will look for opportunities to buy the dip, anticipating the uptrend will resume. Identifying when this dip concludes is crucial. This blog post will analyze that.

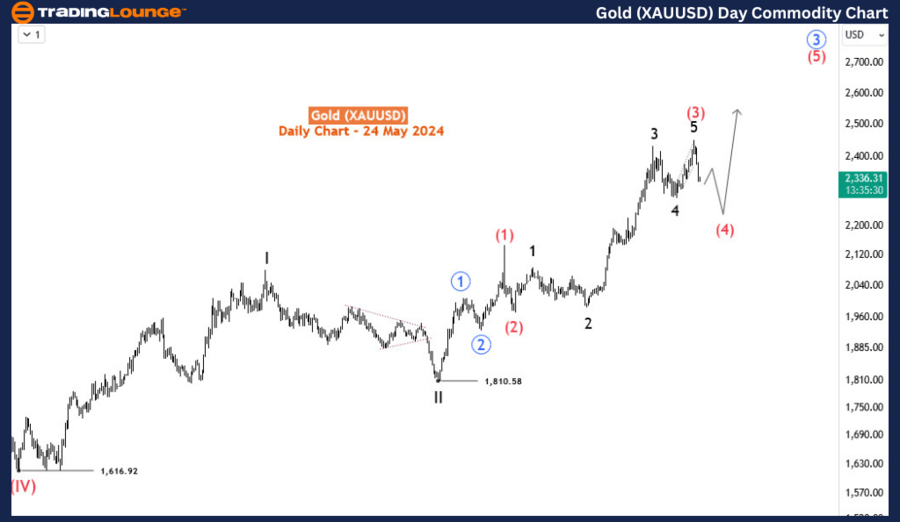
Daily Timeframe Analysis:

The bullish impulse trend on the daily timeframe started from the 1616 low of September 2022. This marked the beginning of the supercycle degree 4th wave of a multi-decade impulse wave. The supercycle 5th wave is still far from completion as it has not yet finished the 3rd sub-wave of its 3rd sub-wave, specifically intermediate wave (3) of primary wave 3 (circled in blue). The current pullback is expected to be wave (4) of the primary degree.
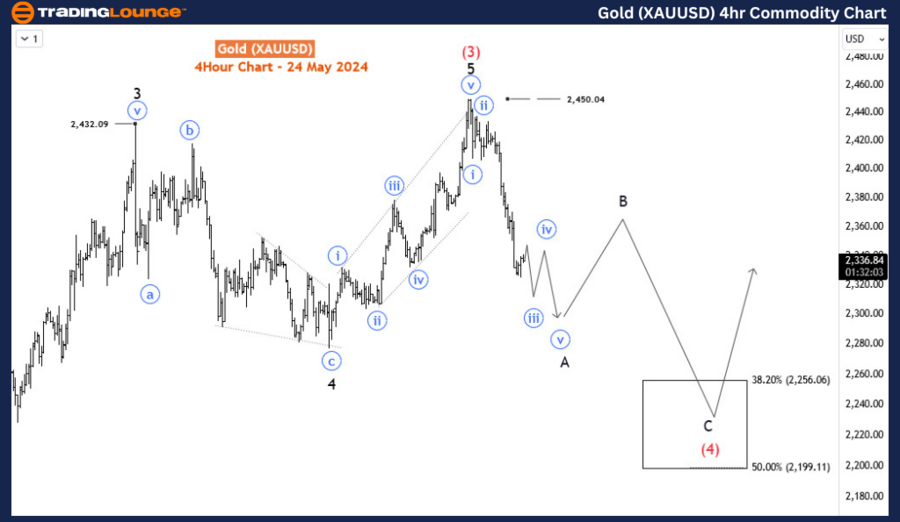
Gold-XAUUSD-Daily-Co...


H4 Chart Analysis:

On the H4 chart, wave (4) is finalizing its first wave—wave A—as an impulse. It is anticipated to correct upwards in wave B before dropping further to form a zigzag pattern, reaching at least the 38.2-50% retracement zone between 2256-2199. Following wave (4), the price could rise again in wave (5). However, alternative scenarios exist. The best alternative is a running flat structure for wave 4 of (3). If the current impulse completes a 3-3-5 structure for wave 4 below its current low and then responds with a bullish impulse, this scenario will be favored.

Conclusion:

In conclusion, Gold's current market position within the Elliott Wave framework indicates a significant pullback phase. Investors should watch for key signals to identify the end of this dip and the resumption of the bullish trend. Understanding these scenarios can provide strategic insights into market entry points for buyers.

Technical Analyst: Sanmi Adeagbo

Source: visit Tradinglounge.com and learn From the Experts Join TradingLounge Here 

See Previous: Iron Ore Commodity Elliott Wave Analysis

Special Trial Offer - 0.76 Cents a Day for 3 Months! Click here

Access 7 Analysts Over 170 Markets Covered. Chat Room With Support

Gold-XAUUSD-4Hr-Comm...

Related

DOGEUSD Elliott Wave Technical Analysis TradingLounge Daily Chart, 12 October 23

DOGEUSD Elliott Wave Technical Analysis TradingLounge Daily Chart, 12 October 23

DOGEUSD Elliott Wave TradingLounge Technical Analysis - DOGEUSD Elliott Wave Analysis Daily Chart, E...

Read More >
Adani Power Elliott Wave Technical Analysis: Stock Forecast, Support & Resistance Levels, and Market Movement Insights

Adani Power Elliott Wave Technical Analysis: Stock Forecast, Support & Resistance Levels, and Market Movement Insights

Elliott Wave analysis of Adani Power stock, covering its price trends, wave counts, and future movem...

Read More >
Unlocking ASX Trading Success: COMPUTERSHARE LIMITED. - CPU Stock Analysis & Elliott Wave Technical Forecast

Unlocking ASX Trading Success: COMPUTERSHARE LIMITED. - CPU Stock Analysis & Elliott Wave Technical Forecast

This comprehensive report offers an in-depth Elliott Wave Technical Analysis of COMPUTERSHARE LIMITE...

Read More >
Euro/ U.S. Dollar (EURUSD) Elliott Wave Analysis: Detailed Market Outlook For Traders & Trading Strategy

Euro/ U.S. Dollar (EURUSD) Elliott Wave Analysis: Detailed Market Outlook For Traders & Trading Strategy

EURUSD Elliott Wave analysis provides a detailed market outlook for traders looking to understand wa...

Read More >
Alibaba Group Holdings Ltd. (BABA) Stock Analysis: Price Prediction, Resistance Levels & Trading Strategy for Market Trends

Alibaba Group Holdings Ltd. (BABA) Stock Analysis: Price Prediction, Resistance Levels & Trading Strategy for Market Trends

Alibaba stock analysis focuses on Elliott Wave patterns to predict BABA’s price movement. Currently...

Read More >
Spotify Technology S.A. (SPOT) Stock Forecast Using Elliott Wave Analysis: Technical Chart Outlook, and Price Target Toward $800

Spotify Technology S.A. (SPOT) Stock Forecast Using Elliott Wave Analysis: Technical Chart Outlook, and Price Target Toward $800

Spotify Technology S.A. (SPOT) applies Elliott Wave Theory to both daily and intraday 1-hour charts....

Read More >

Buy 1 Month

Get 3 Months!

Special Offer:

Trade Recommendations

Unleash the power of deversified trading with our comprehensive portfolio, covering:

  • Stock Trades
  • Crypto Trades
  • Forex Trades
  • Commodity Trades
Elliott Wave Analysis

Gain a competive edge with expert insights in to:

  • Global Indices
  • US Stocks & ASX Stocks
  • Forex & Crypto
  • Commodities
Top-Notch Trading Tools

Equip yourself with the tools of success:

  • Social Chat
  • Elliott Wave Algorithm
  • Screener
  • TradingLevels
  • Trading Game
7 Elliott Wave Analysts

Stay ahead of the market with daily charts and insightful videos
-Your secret to strategic trading!

JOIN HERE


Welcome to TradingLounge (ASIC A.R.No. 321187), specialists in trades, trading education and technical analysis, covering stocks, indices, commodities, forex and cryptocurrencies.

When you join TradingLounge you have access to everything we offer, including trade tools, educational content and a social platform to chat with like-minded investors.

Read more

@Copyright 2024 by tradinglounge.com

Contact Us

Australian no: 02 4787 6020

International no: +61 (2) 47876020

Pay with:

Find us on