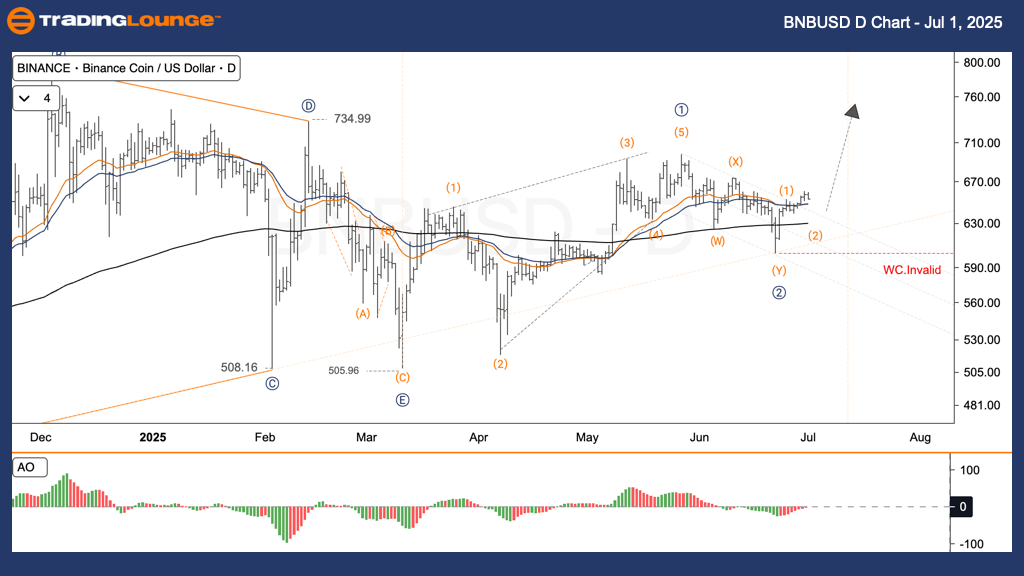
Binance / U.S. Dollar (BNBUSD) Elliott Wave Analysis – TradingLounge Daily Chart
BNBUSD Elliott Wave Technical Analysis
Function: Trend Continuation
Mode: Motive
Structure: Impulse
Current Position: Wave 2
Next Higher Degree Direction: Advancing into Wave IV (Impulse)
Invalidation Level: $597
BNBUSD Daily Trading Strategy
Binance Coin (BNBUSD) is potentially completing a corrective phase, with Wave ② likely ending near the 50% - 61.8% Fibonacci retracement level. This price zone signals the initiation of a new bullish wave ③, possibly marking the start of a sustained upward trend.
Trading Strategies
✅ Swing Trading Opportunity
Traders can look for bullish price action near $633 to enter a long position targeting Wave ③ development.
🟥 Invalidation Level Alert
If the market breaks below $597, the current wave count is invalid, and the Elliott Wave analysis should be reassessed.
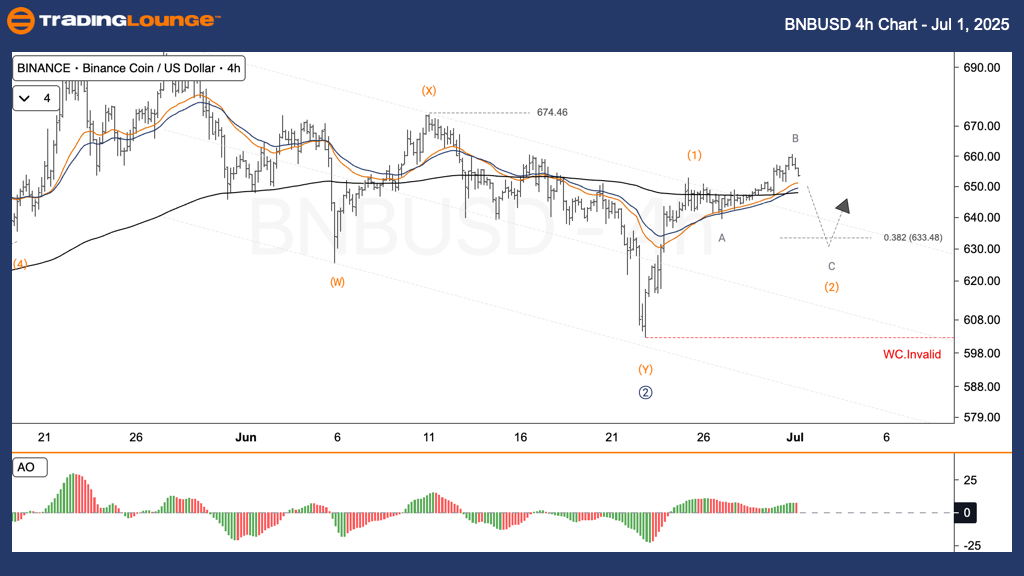
Binance / U.S. Dollar (BNBUSD) Elliott Wave Analysis – TradingLounge H4 Chart
BNBUSD Elliott Wave Technical Analysis
Function: Trend Continuation
Mode: Motive
Structure: Impulse
Current Position: Wave 2
Next Higher Degree Direction: Advancing into Wave IV (Impulse)
Invalidation Level: $597
BNBUSD H4 Trading Strategy
The H4 chart for BNBUSD reflects the likely conclusion of corrective Wave ② around the 50% - 61.8% Fibonacci retracement range. This indicates the beginning of Wave ③, with price movement suggesting a bullish shift.
Trading Strategies
✅ Swing Trade Setup
A potential bullish reversal around $633 could be used to enter long positions in anticipation of a medium-term rally.
🟥 Wave Count Checkpoint
Should the price fall below $597, the current Elliott Wave setup must be reviewed to adjust strategy accordingly.
Technical Analyst: Kittiampon Somboonsod, CEWA
Source: Visit Tradinglounge.com and learn from the Experts. Join TradingLounge Here
Previous: ETHUSD Elliott Wave Technical Analysis
VALUE Offer - $1 for 2 Weeks then $29 a month!Click here
Access 7 Analysts Over 200 Markets Covered. Chat Room With Support