14Aug

Get the Latest ChainLink Crypto price prediction News Today with our in-depth LINKUSD Elliott Wave Technical Analysis Elliott Wave analysis

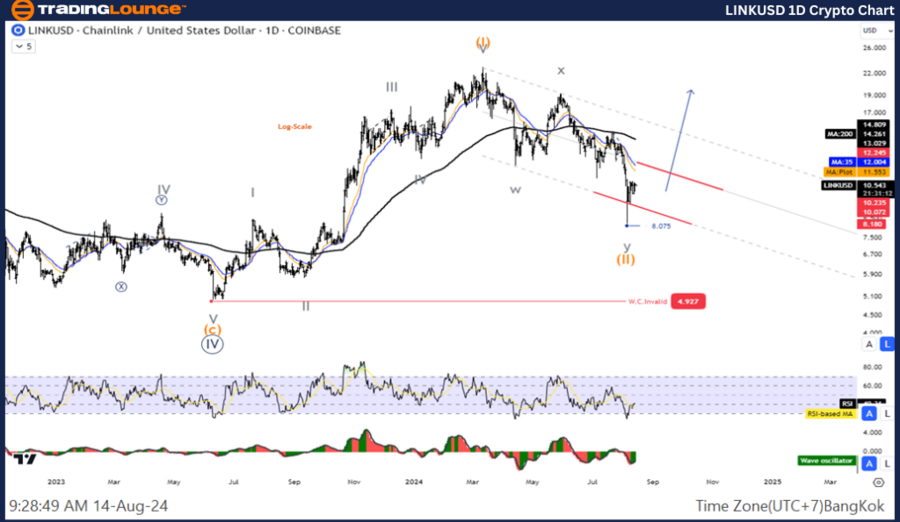
LINKUSD Elliott Wave Analysis - TradingLounge Daily Chart

ChainLink/U.S. Dollar (LINKUSD) Daily Chart Analysis

LINKUSD Elliott Wave Technical Analysis

Function: Counter Trend

Mode: Corrective

Structure: Double Corrective

Position: Wave Y

Next Higher Degree: Wave ((II)) of Impulse

Wave Invalid Level: 8.498

Details: Wave (II) appears to have concluded, with prices likely resuming the uptrend.

ChainLink/U.S. Dollar (LINKUSD) Trading Strategy:

ChainLink remains in a corrective phase. Currently positioned in Wave (II) with a double corrective structure, a short-term pullback is anticipated before the upward movement in Wave (III) continues. Traders should wait for the correction to complete before re-entering the uptrend.

ChainLink/U.S. Dollar (LINKUSD) Technical Indicators:

  • The price is trading below the MA200, indicating a persistent downtrend.
  • The Wave Oscillator reflects bearish momentum.

LINKUSD-1D-Crypto-Ch...


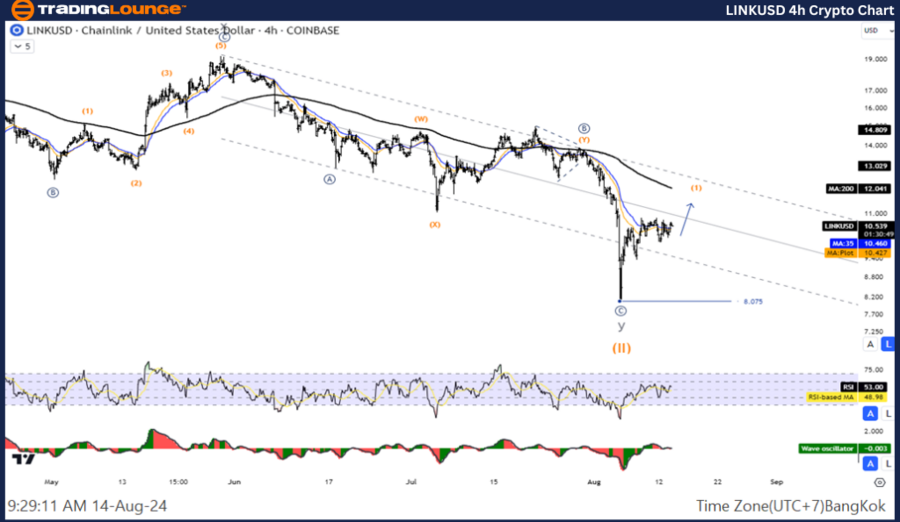
LINKUSD Elliott Wave Analysis - TradingLounge H4 Chart

ChainLink/U.S. Dollar (LINKUSD) 4-Hour Chart Analysis

LINKUSD Elliott Wave Technical Analysis

Function: Counter Trend

Mode: Corrective

Structure: Double Corrective

Position: Wave Y

Next Higher Degree: Wave ((II)) of Impulse

Wave Invalid Level: 8.498

Details: Wave (II) seems to have been completed, with prices showing signs of resuming the uptrend.

ChainLink/U.S. Dollar (LINKUSD) Trading Strategy:

ChainLink is still undergoing a correction. Positioned within Wave (II) and exhibiting a double corrective pattern, a short-term pullback is expected before the price resumes its rise in Wave (III). Traders should be patient, waiting for the correction to end before rejoining the uptrend.

ChainLink/U.S. Dollar (LINKUSD) Technical Indicators:

  • The price is currently below the MA200, indicating a downtrend.
  • The Wave Oscillator is signaling bearish momentum.

Technical Analyst:  Kittiampon Somboonsod

Source: visit Tradinglounge.com and learn From the Experts Join TradingLounge Here 

See Previous: Bitcoin/U.S. Dollar (BTCUSD) Elliott Wave Technical Analysis

Special Trial Offer - 0.76 Cents a Day for 3 Months! Click here

Access 7 Analysts Over 170 Markets Covered. Chat Room With Support

LINKUSD-4h-Crypto-Ch...

Related

U.S.Dollar/Canadian Dollar(USD/CAD) Elliott Wave Technical Analysis 24 October 23

U.S.Dollar/Canadian Dollar(USD/CAD) Elliott Wave Technical Analysis 24 October 23

In summary, the USD/CAD Elliott Wave Analysis for 24 October 23, is significant for traders seeking ...

Read More >
Unlock the Future of Dogecoin Crypto Price: Expert DOGEUSD Elliott Wave Technical Analysis and Trading Strategies

Unlock the Future of Dogecoin Crypto Price: Expert DOGEUSD Elliott Wave Technical Analysis and Trading Strategies

This article provides a detailed Elliott Wave analysis of DOGEUSD, offering insights into Dogecoin&#...

Read More >
Unlocking ASX Trading Success: V300AEQ ETF UNITS – VAS Stock Analysis & Elliott Wave Technical Forecast

Unlocking ASX Trading Success: V300AEQ ETF UNITS – VAS Stock Analysis & Elliott Wave Technical Forecast

This article provides a detailed Elliott Wave analysis of ASX: V300AEQ ETF (VAS), focusing on curren...

Read More >
NextEra Energy Inc.(NEE) Stocks Elliott Wave Technical Analysis: Covers Stock Predictions, Technical insights, And wave pattern analysis

NextEra Energy Inc.(NEE) Stocks Elliott Wave Technical Analysis: Covers Stock Predictions, Technical insights, And wave pattern analysis

This article provides an in-depth Elliott Wave analysis of NextEra Energy Inc. (NEE) on both daily a...

Read More >
Polkadot Crypto Price News Today Elliott Wave Technical Analysis of Polkadot (DOT/USD): Comprehensive Guide

Polkadot Crypto Price News Today Elliott Wave Technical Analysis of Polkadot (DOT/USD): Comprehensive Guide

This article provides an in-depth Elliott Wave analysis of Polkadot (DOT/USD), offering insights int...

Read More >
Learn about the current stock trend: Texas Instruments Inc.(TXN) Stocks Elliott Wave Technical Analysis

Learn about the current stock trend: Texas Instruments Inc.(TXN) Stocks Elliott Wave Technical Analysis

Explore an in-depth Elliott Wave analysis for Texas Instruments Inc. (TXN), including daily and 4-ho...

Read More >

Buy 1 Month

Get 3 Months!

Special Offer:

Trade Recommendations

Unleash the power of deversified trading with our comprehensive portfolio, covering:

  • Stock Trades
  • Crypto Trades
  • Forex Trades
  • Commodity Trades
Elliott Wave Analysis

Gain a competive edge with expert insights in to:

  • Global Indices
  • US Stocks & ASX Stocks
  • Forex & Crypto
  • Commodities
Top-Notch Trading Tools

Equip yourself with the tools of success:

  • Social Chat
  • Elliott Wave Algorithm
  • Screener
  • TradingLevels
  • Trading Game
7 Elliott Wave Analysts

Stay ahead of the market with daily charts and insightful videos
-Your secret to strategic trading!

JOIN HERE


Welcome to TradingLounge (ASIC A.R.No. 321187), specialists in trades, trading education and technical analysis, covering stocks, indices, commodities, forex and cryptocurrencies.

When you join TradingLounge you have access to everything we offer, including trade tools, educational content and a social platform to chat with like-minded investors.

Read more

@Copyright 2024 by tradinglounge.com

Contact Us

Australian no: 02 4787 6020

International no: +61 (2) 47876020

Pay with:

Find us on