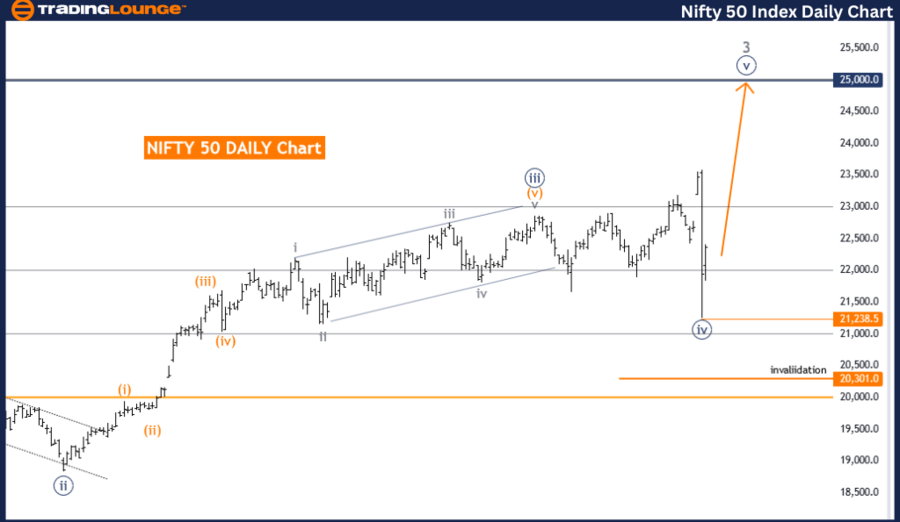
NIFTY 50 (India) Elliott Wave Analysis Trading Lounge Day Chart
NIFTY 50 (India) Elliott Wave Technical Analysis
FUNCTION: Trend
MODE: Impulsive
STRUCTURE: Navy Blue Wave 5
POSITION: Gray wave 3
DIRECTION NEXT LOWER DEGREES: Gray wave 4
DETAILS: Navy Blue Wave 4 appears complete. Now, navy blue wave 5 of 3 is in play.
Wave Cancel Invalid Level: 20301.0
The NIFTY 50 (India) Elliott Wave Analysis on the day chart focuses on the current market trends using Elliott Wave Theory. This analysis shows a trending market, with an impulsive mode indicating strong movement in the trend's direction, represented by a five-wave pattern.
In this scenario, the structure under review is navy blue wave 5, part of a larger gray wave 3, suggesting an advanced stage of an upward trend in the final wave of the impulsive sequence. The current position is gray wave 3, indicating the third wave within the larger wave 5.
The analysis details that navy blue wave 4 is completed, ending a corrective phase within the larger trend, allowing the market to resume its upward movement. Now, navy blue wave 5 of gray wave 3 is in play, indicating continued upward momentum.
The next lower degree direction is gray wave 4, expected after the current wave completes, likely involving a pullback or consolidation before continuing the main trend.
The critical level to monitor is the wave cancel invalid level set at 20301.0. If the market price drops below this level, the current wave count would be invalidated, requiring a reevaluation of the wave structure.
In summary, the NIFTY 50 Elliott Wave Analysis indicates an ongoing upward trend within an impulsive wave structure. With navy blue wave 4 completed and navy blue wave 5 of gray wave 3 currently in play, the market is expected to see further upward movement, provided it stays above the invalidation level of 20301.0. This analysis offers insights for traders on current market dynamics and potential future trends.
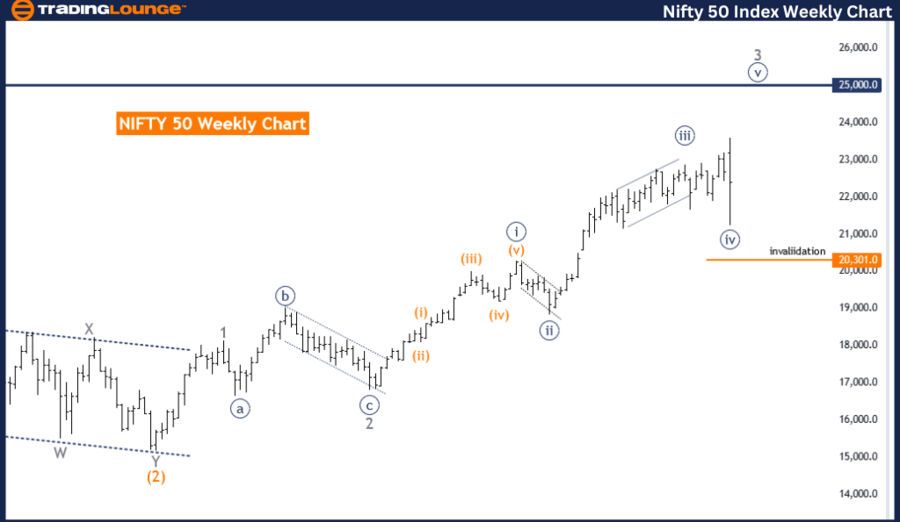
NIFTY 50 (India) Elliott Wave Analysis Trading Lounge Weekly Chart
NIFTY 50 (India) Elliott Wave Technical Analysis
FUNCTION: Trend
MODE: Impulsive
STRUCTURE: Navy Blue Wave 5
POSITION: Gray wave 3
DIRECTION NEXT LOWER DEGREES: Gray wave 4
DETAILS: Navy Blue Wave 4 appears completed. Now, navy blue wave 5 of 3 is in play.
Wave Cancel Invalid Level: 20301.0
The NIFTY 50 (India) Elliott Wave Analysis on the weekly chart focuses on the market's long-term trend and forecasts its future movements using Elliott Wave Theory. This analysis identifies the primary trend of the NIFTY 50 index. The mode is impulsive, showing strong, directional movements in line with the main trend, characterized by a five-wave pattern.
The structure analyzed is navy blue wave 5, part of a larger gray wave 3, indicating the market is in the third wave of a larger five-wave pattern, suggesting a continuing upward trend. The market's specific position is gray wave 3, typically the strongest and longest wave in the sequence.
The analysis details that navy blue wave 4 is likely completed, suggesting the market has finished a corrective phase and is now entering the fifth wave of the navy blue wave sequence, part of the larger gray wave 3. Now, navy blue wave 5 of 3 is in play, indicating a continuation of the upward trend.
The wave cancel invalid level is set at 20301.0. If the market moves below this level, it would invalidate the current wave count, suggesting a different wave structure might be forming.
Overall, the NIFTY 50 is expected to continue its upward trend with navy blue wave 5 now active, following the completion of navy blue wave 4 within the larger structure of gray wave 3. This analysis aids traders and investors in anticipating future market movements and making informed decisions based on the Elliott Wave Theory.
Technical Analyst: Malik Awais
Source: visit Tradinglounge.com and learn From the Experts Join TradingLounge Here
See previous: KOSPI Composite Elliott Wave Technical Analysis
Special Trial Offer - 0.76 Cents a Day for 3 Months! Click here
Access 7 Analysts Over 170 Markets Covered. Chat Room With Support