USDCHF Elliott Wave Analysis – Trading Lounge Day Chart
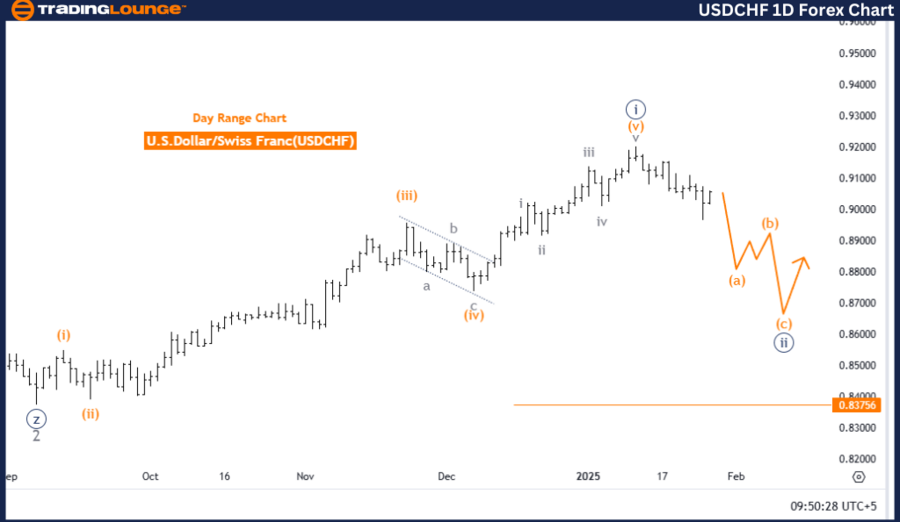
U.S. Dollar / Swiss Franc (USDCHF) – Day Chart Analysis
USDCHF Elliott Wave Technical Analysis
Function: Counter Trend
Mode: Corrective
Structure: Orange Wave A
Position: Navy Blue Wave 2
Next Higher Degree Direction: Orange Wave B
Details: Navy Blue Wave 1 appears to have concluded, with Orange Wave A of 2 currently unfolding.
Wave Cancel Invalidation Level: 0.83756
Analysis Overview
This daily chart analysis applies Elliott Wave Theory to evaluate the USDCHF currency pair, emphasizing a counter-trend movement in a corrective mode. The current focus is on Orange Wave A, which has emerged following the completion of Navy Blue Wave 1.
The pair is in the Navy Blue Wave 2 phase, representing a temporary pullback that consolidates the gains from Navy Blue Wave 1. Upon completion of Orange Wave A, the next phase, Orange Wave B, is anticipated to mark the continuation of the corrective wave structure at a higher degree.
The invalidation level for this analysis is 0.83756. A price movement below this threshold would invalidate the current wave structure and require a fresh reassessment of the technical outlook.
Summary
The USDCHF daily chart analysis identifies the ongoing corrective phase defined by Orange Wave A within Navy Blue Wave 2. Following the completion of Navy Blue Wave 1, this pullback phase sets the stage for the development of Orange Wave B as the corrective trend persists.
The 0.83756 invalidation level provides a critical risk-management benchmark to validate the current wave count. This structured approach offers traders insights into the market's corrective movements while enabling preparation for potential directional shifts within the Elliott Wave framework.
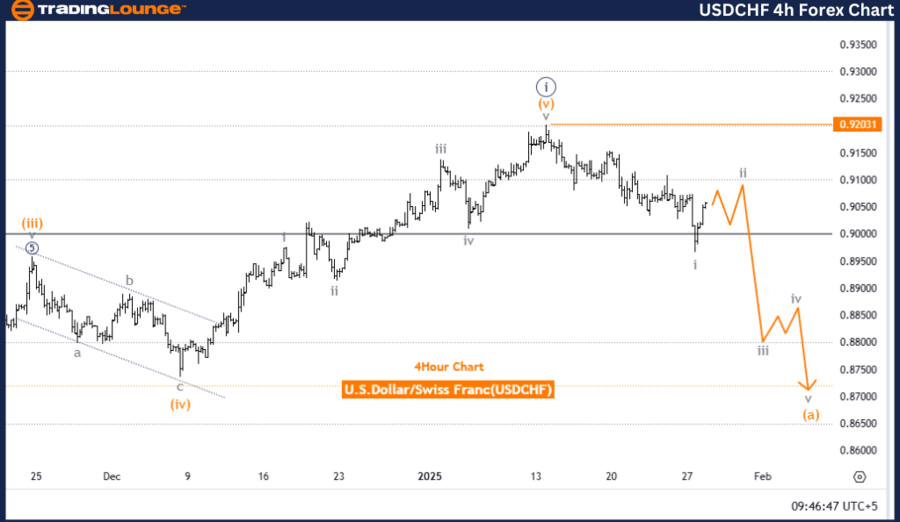
U.S. Dollar / Swiss Franc (USDCHF) – 4-Hour Chart Analysis
USDCHF Elliott Wave Technical Analysis
Function: Counter Trend
Mode: Corrective
Structure: Gray Wave 2
Position: Orange Wave A
Next Lower Degree Direction: Gray Wave 3
Details: Gray Wave 1 appears complete, and Gray Wave 2 is now unfolding.
Wave Cancel Invalidation Level: 0.92031
USDCHF Analysis Overview
The 4-hour chart analysis of USDCHF highlights a counter-trend corrective movement based on Elliott Wave Theory. The primary structure in focus is Gray Wave 2, which follows the completion of Gray Wave 1, signaling a temporary consolidation phase.
The pair is currently progressing through Orange Wave A, representing the initial phase of Gray Wave 2. This stage reflects a pullback in the market as it consolidates gains made during Gray Wave 1. Upon completing Gray Wave 2, the emergence of Gray Wave 3 is expected, potentially signaling a return to bullish momentum and alignment with the broader trend.
The invalidation level for this analysis is set at 0.92031. A price drop below this level would invalidate the wave count and require an updated technical perspective.
Summary
The 4-hour chart analysis for USDCHF indicates a counter-trend corrective phase, led by Gray Wave 2. After the conclusion of Gray Wave 1, the current position within Orange Wave A signals a temporary pullback. The anticipated development of Gray Wave 3 suggests a resumption of the broader upward trend.
The 0.92031 invalidation level serves as a key reference for risk management and wave count validation. This structured analysis provides actionable insights into the ongoing corrective movements, helping traders prepare for potential market shifts in the context of the Elliott Wave framework.
Technical Analyst: Malik Awais
Source: visit Tradinglounge.com and learn From the Experts Join TradingLounge Here
Previous: British Pound/ U.S. Dollar (GBPUSD) Elliott Wave Technical Analysis
VALUE Offer - Buy 1 Month & Get 3 Months!Click here
Access 7 Analysts Over 200 Markets Covered. Chat Room With Support