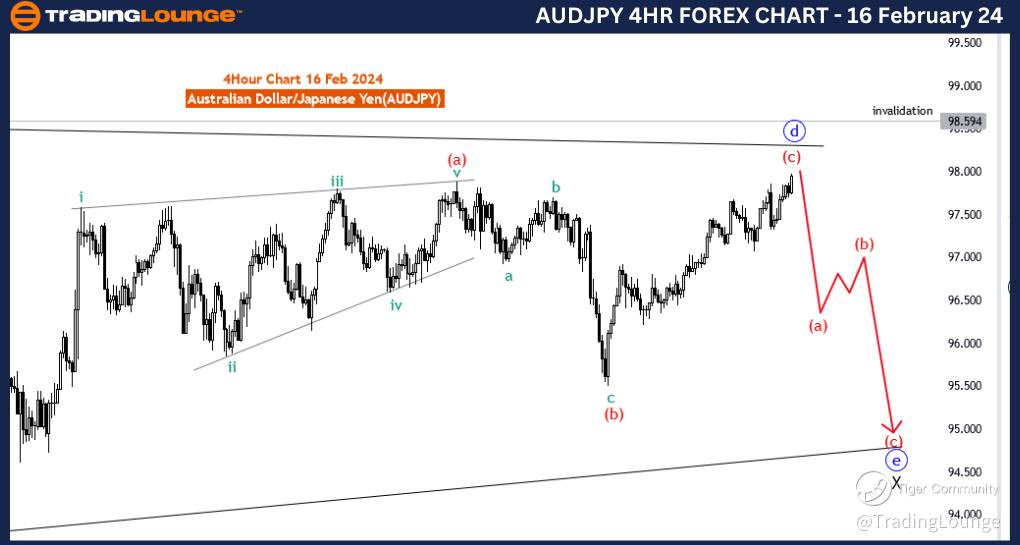
AUDJPY Elliott Wave Analysis Trading Lounge 4 Hour Chart,16 February 24
Australian Dollar/Japanese Yen(AUDJPY) 4 Hour Chart
AUDJPY Elliott Wave Technical Analysis
FUNCTION: Counter Trend
MODE: Corrective
STRUCTURE: blue wave D of triangle
POSITION: black wave X
DIRECTION NEXT LOWER DEGREES: blue wave E
DETAILS: Blue Wave D is in play looking near to end . Wave Cancel invalid level: 98.594
The "AUDJPY Elliott Wave Analysis Trading Lounge 4 Hour Chart" dated Australian Dollar / Japanese Yen(AUDJPY) 4 Hour Chart Elliott Wave Technical Analysis 16 February 24, provides a detailed examination of the Australian Dollar/Japanese Yen (AUDJPY) currency pair using Elliott Wave theory. This analysis is specifically focused on the 4-hour chart, offering insights into potential price movements for traders navigating the forex market.
The identified "FUNCTION" is "Counter Trend," indicating that the analysis is primarily concerned with a corrective phase within the broader market trend. This is essential information for traders looking to capitalize on countertrend opportunities or position themselves for potential trend reversals.
The specified "MODE" is "Corrective," signaling that the market is currently undergoing a corrective wave. Corrective waves are instrumental in understanding temporary price movements that deviate from the primary trend, providing traders with opportunities for strategic decision-making.
The described "STRUCTURE" is "blue wave D of triangle," suggesting that the ongoing price action is part of a larger triangular pattern. Triangles are corrective patterns characterized by converging trendlines and typically precede a continuation of the prior trend. In this case, blue wave D is highlighted as the current segment of the triangle in play.
The designated "POSITION" is "black wave X," indicating the current position within the Elliott Wave hierarchy. In the context of corrective patterns like triangles, wave X often represents a connecting wave between different legs of the correction.
Concerning "DIRECTION NEXT LOWER DEGREES," the analysis points to "blue wave E," indicating the expected direction of the next lower-degree wave. Traders can use this information to anticipate potential future price movements within the context of the larger correction.
In the "DETAILS" section, it is emphasized that "blue wave D" is currently in play and is approaching its conclusion. The analysis suggests that wave D is "looking near to end." Additionally, a critical "Wave Cancel invalid level" is specified at "98.594." This level serves as a key reference point, with a breach potentially indicating a shift in the anticipated wave count or pattern.
In conclusion, the AUDJPY Elliott Wave Analysis for the 4-hour chart on Australian Dollar / Japanese Yen(AUDJPY) 4 Hour Chart Elliott Wave Technical Analysis 16 February 24, suggests that the market is in a corrective phase, specifically within the context of a triangle. Traders are advised to closely monitor the ongoing wave D, considering its potential completion, and pay attention to the specified invalidation level at 98.594 for potential shifts in market dynamics.
Technical Analyst: Malik Awais
Source: visit Tradinglounge.com and learn From the Experts Join TradingLounge Here
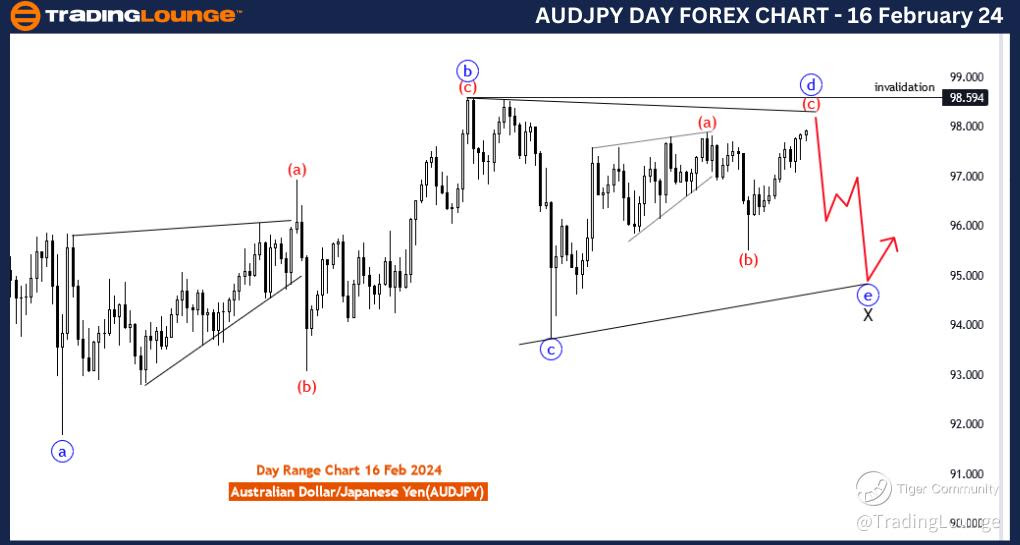
AUDJPY Elliott Wave Analysis Trading Lounge Day Chart,16 February 24
Australian Dollar / Japanese Yen(AUDJPY) Day Chart
AUDJPY Elliott Wave Technical Analysis
FUNCTION: Counter Trend
MODE: Corrective
STRUCTURE: blue wave D of triangle
POSITION: black wave X
DIRECTION NEXT LOWER DEGREES: blue wave E
DETAILS: blue wave D is in play looking near to end . Wave Cancel invalid level: 98.594
The "AUDJPY Elliott Wave Analysis Trading Lounge Day Chart" dated 16 February 24, provides a comprehensive examination of the Australian Dollar/Japanese Yen (AUDJPY) currency pair using Elliott Wave theory. This analysis focuses specifically on the day chart, offering insights into potential longer-term price movements for traders navigating the forex market.
The identified "FUNCTION" is "Counter Trend," signifying that the analysis is primarily concerned with a corrective phase within the broader market trend. This is crucial information for traders looking to identify countertrend opportunities or position themselves for potential trend reversals.
The specified "MODE" is "Corrective," indicating that the market is currently undergoing a corrective wave. Corrective waves are essential in understanding temporary price movements that deviate from the primary trend, providing traders with opportunities for strategic decision-making.
The described "STRUCTURE" is "blue wave D of triangle," suggesting that the ongoing price action is part of a larger triangular pattern. Triangles are corrective patterns characterized by converging trendlines and typically precede a continuation of the prior trend. In this case, blue wave D is highlighted as the current segment of the triangle in play.
The designated "POSITION" is "black wave X," indicating the current position within the Elliott Wave hierarchy. In the context of corrective patterns like triangles, wave X often represents a connecting wave between different legs of the correction.
Concerning "DIRECTION NEXT LOWER DEGREES," the analysis points to "blue wave E," indicating the expected direction of the next lower-degree wave. Traders can use this information to anticipate potential future price movements within the context of the larger correction.
In the "DETAILS" section, it is emphasized that "blue wave D" is currently in play and is approaching its conclusion. The analysis suggests that wave D is "looking near to end." Additionally, a critical "Wave Cancel invalid level" is specified at "98.594." This level serves as a key reference point, with a breach potentially indicating a shift in the anticipated wave count or pattern.
In conclusion, the AUDJPY Elliott Wave Analysis for the day chart on 16 February 24, suggests that the market is in a corrective phase, specifically within the context of a triangle. Traders are advised to closely monitor the ongoing wave D, considering its potential completion, and pay attention to the specified invalidation level at 98.594 for potential shifts in market dynamics.
Technical Analyst: Malik Awais
Source: visit Tradinglounge.com and learn From the Experts Join TradingLounge Here
See Previous: Australian Dollar/U.S.Dollar(AUDUSD)