Coffee Elliott Wave Analysis
Coffee prices have rebounded strongly after a sharp drop in late November. The next potential breakout could push prices to levels unseen since the 1970s. Over the past several decades, coffee has traded within a $300-wide range. Is the market poised to break this range and set new record highs?
Coffee Daily Chart Analysis
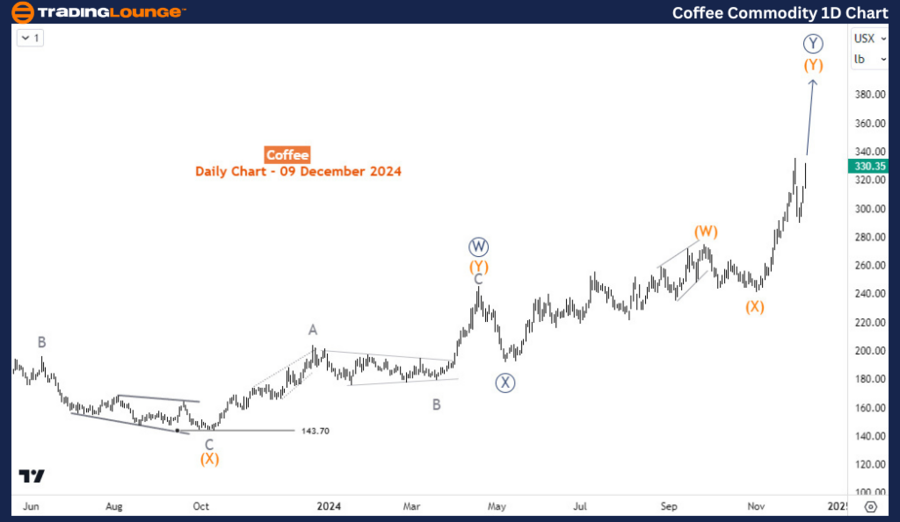
The daily chart suggests coffee prices are unfolding into a double zigzag structure, beginning from the January 2023 low of $141.85. This pattern includes:
- Wave ((W)): Completed in April 2024.
- Wave ((X)): A corrective dip that ended in May 2024.
- Wave ((Y)): Currently underway, indicating an upward trajectory.
The price appears to be moving along wave (Y) of ((Y)), leaving room for further gains before a significant correction.

Coffee H4 Chart Analysis
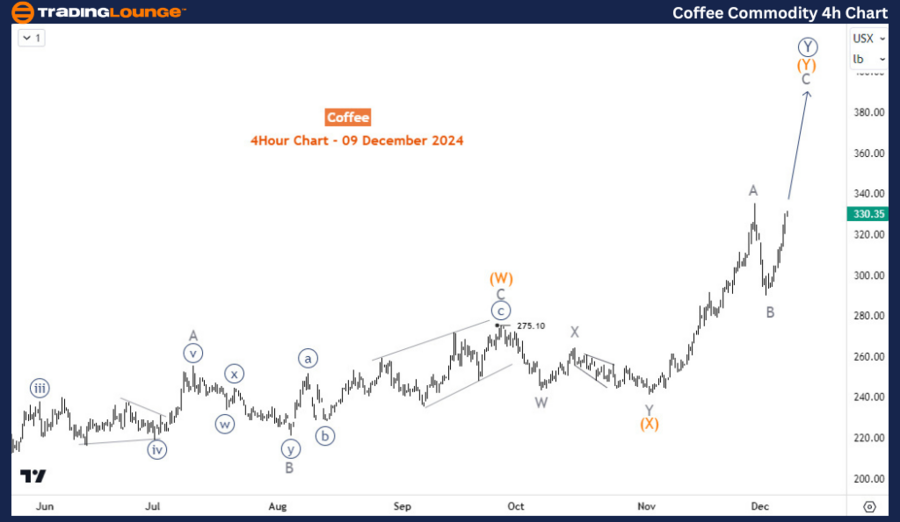
On the H4 chart, coffee prices seem to have completed Wave A of (Y) and possibly Wave B in early December. If the ongoing rally surpasses the previous Wave A high, the price is likely to target $385 in the coming days. This movement could lead to a new record high, signaling continued bullish momentum for the commodity.
Technical Analyst: Sanmi Adeagbo
Source: visit Tradinglounge.com and learn From the Experts Join TradingLounge Here
See Previous: Silver Elliott Wave Technical Analysis
VALUE Offer - Buy 1 Month & Get 3 Months!Click here
Access 7 Analysts Over 200 Markets Covered. Chat Room With Support
