24Jun

EICHER MOTORS - EICHERMOT Indian Stocks Elliott Wave Technical Analysis: Suggests Continued Upside Amid Critical Trend Structure Signals

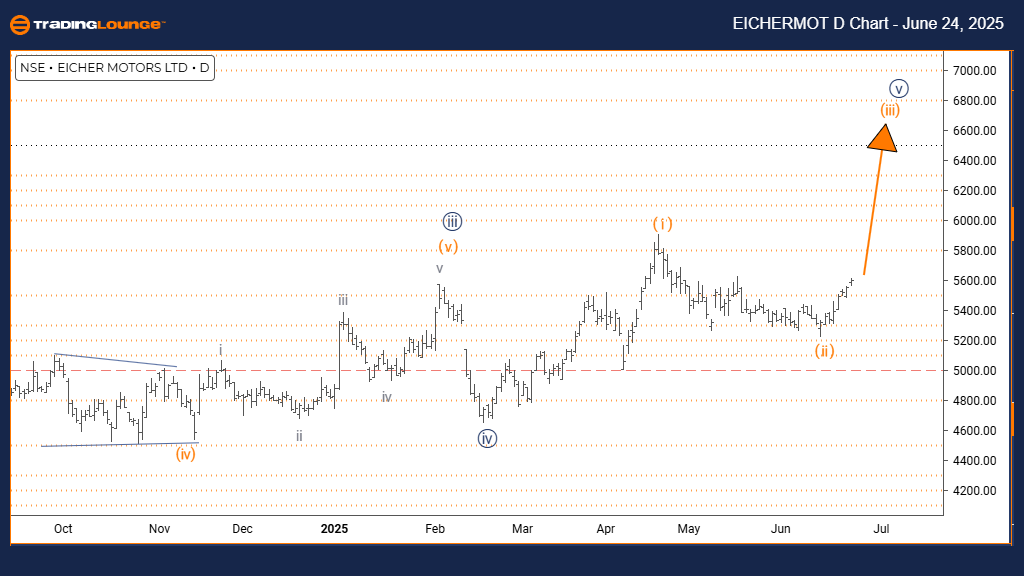
EICHER MOTORS Elliott Wave Analysis – Trading Lounge Day Chart

EICHER MOTORS Day Chart Analysis

EICHER MOTORS Elliott Wave Technical Analysis

FUNCTION: Bullish Market Trend

MODE: Impulsive Pattern

STRUCTURE: Developing Orange Wave 3

POSITION: Advancing Navy Blue Wave 5

DIRECTION NEXT LOWER DEGREES: Formation of Orange Wave 4

DETAILS:

Orange Wave 2 appears completed, initiating the upward move of Orange Wave 3 or the final phase of Navy Blue Wave 5.

The daily Elliott Wave analysis of EICHER MOTORS stock highlights a clear bullish trend. The chart displays an impulsive structure, supporting upward price momentum. Currently, Orange Wave 3 is evolving, embedded within the larger Navy Blue Wave 5. This structure suggests a sustained rally nearing the end phase of a long-term bullish cycle.

With Orange Wave 2 likely finalized, price action has entered the dynamic Orange Wave 3 – typically the strongest wave in Elliott theory. This wave often drives rapid price increases. Once Orange Wave 3 completes, a corrective Orange Wave 4 is expected before any further upward movement resumes.

This Elliott Wave pattern implies that EICHER MOTORS shares could extend their upward momentum. As Orange Wave 3 progresses, strong buying activity is anticipated. However, traders should monitor closely, as this third wave unfolds within a fifth wave, hinting at the nearing conclusion of Navy Blue Wave 5’s broader cycle.

EICHERMOT-Day-chart-...


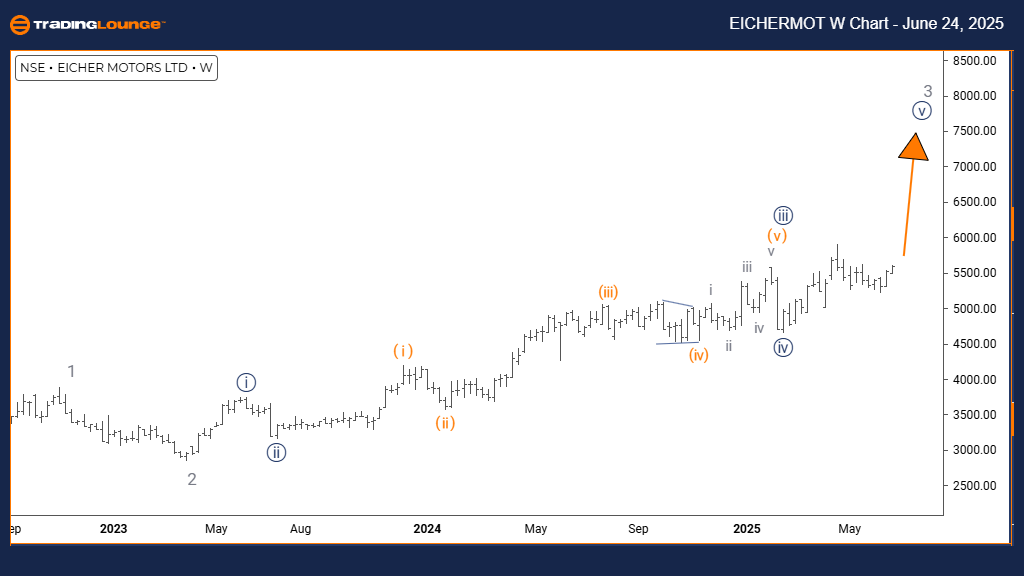
EICHER MOTORS Elliott Wave Analysis – Trading Lounge Weekly Chart

EICHER MOTORS Elliott Wave Technical Analysis

FUNCTION: Continued Bullish Trend

MODE: Impulsive Movement

STRUCTURE: Progressing Navy Blue Wave 5

POSITION: Active Gray Wave 3

DIRECTION NEXT HIGHER DEGREES: Navy Blue Wave 5 Continuation

DETAILS:

Navy Blue Wave 4 has concluded; Navy Blue Wave 5 of 3 is currently developing.

The weekly Elliott Wave chart of EICHER MOTORS confirms a long-term bullish trajectory. The price is moving impulsively, with the pattern showing the progression of Navy Blue Wave 5 within Gray Wave 3. This configuration signals the stock is advancing through the last leg of its upward cycle.

Navy Blue Wave 4’s correction appears complete, allowing for the start of Navy Blue Wave 5. Historically, this wave exhibits strong price action and marks the conclusion of an Elliott sequence. As this fifth wave develops under Gray Wave 3, potential price gains could remain, though a trend reversal may follow.

This technical structure indicates possible further upside for EICHER MOTORS stock. With Navy Blue Wave 5 gaining traction, buyer interest remains robust. Still, since this is the fifth wave of Gray Wave 3, caution is recommended as the stock may soon approach the end of its current bullish trend.

Technical Analyst: Malik Awais

Source: Visit Tradinglounge.com and learn from the Experts. Join TradingLounge Here

Previous: AXIS BANK Elliott Wave Technical Analysis

VALUE Offer - $1 for 2 Weeks then $29 a month!Click here

Access 7 Analysts Over 200 Markets Covered. Chat Room With Support

EICHERMOT-w-chart-24...

Related

Euro/U.S.Dollar(EURUSD) Forex Elliott Wave Technical Analysis: Comprehensive Look at Trading Patterns

Euro/U.S.Dollar(EURUSD) Forex Elliott Wave Technical Analysis: Comprehensive Look at Trading Patterns

Our detailed EURUSD Elliott Wave analysis helps traders anticipate EURUSD movements by outlining key...

Read More >
Bajaj Auto Stock and Elliott Wave technical Analysis: Identifying key Support and Resistance levels, and potential trading opportunities

Bajaj Auto Stock and Elliott Wave technical Analysis: Identifying key Support and Resistance levels, and potential trading opportunities

This Bajaj Auto stock analysis covers Elliott Wave technical patterns, identifying key support and r...

Read More >
Bitcoin Crypto Price News Today BTCUSD Elliott Wave Technical Analysis to predict Bitcoin price movements

Bitcoin Crypto Price News Today BTCUSD Elliott Wave Technical Analysis to predict Bitcoin price movements

Stay updated with the latest BTCUSD Elliott Wave Analysis to predict Bitcoin price movements. Unders...

Read More >
NASDAQ Elliott Wave Analysis: SPX, JPM, AAPL, AMZN, NVDA, TSLA, GOOGL, META, NFLX, MSFT 2024 Forecast

NASDAQ Elliott Wave Analysis: SPX, JPM, AAPL, AMZN, NVDA, TSLA, GOOGL, META, NFLX, MSFT 2024 Forecast

This article offers a detailed Elliott Wave analysis of the NASDAQ stock market, focusing on key tec...

Read More >
Best CAC 40 stocks to buy & Investment Tips With CAC 40 (France) Elliott Wave Technical Analysis

Best CAC 40 stocks to buy & Investment Tips With CAC 40 (France) Elliott Wave Technical Analysis

Explore our comprehensive guide to CAC 40 trading and investing, featuring expert Elliott Wave analy...

Read More >
Wheat Commodity Elliott Wave Technical Analysis: Bullish Corrections and Future Price Movements in Wheat Futures

Wheat Commodity Elliott Wave Technical Analysis: Bullish Corrections and Future Price Movements in Wheat Futures

Our latest wheat price forecast for 2024 is based on Elliott Wave analysis, highlighting key market ...

Read More >

$1 for 2 Weeks

then $29 a month!

What a Special Offer!

Trade Recommendations

Unleash the power of deversified trading with our comprehensive portfolio, covering 250+ markets:

  • Stock Trades
  • Crypto Trades
  • Forex Trades
  • Commodity Trades
Elliott Wave Analysis

Gain a competitive edge with expert insights and AI-powered Elliott Wave charting into:

  • Global Indices
  • US Stocks & ASX Stocks
  • Forex & Crypto
  • Commodities
Top-Notch Trading Tools

Equip yourself with the tools of success:

  • Real-time Chat rooms
  • Elliott Wave Algorithm
  • Portfolio tools
  • TradingLevels
  • Screener
  • Trading Game
7 Elliott Wave Analysts

Stay ahead of the market with daily charts and insightful videos
Your secret to strategic trading!

JOIN HERE


Welcome to TradingLounge (ASIC A.R.No. 321187), specialists in trades, trading education and technical analysis, covering stocks, indices, commodities, forex and cryptocurrencies.

When you join TradingLounge you have access to everything we offer, including trade tools, educational content and a social platform to chat with like-minded investors.

Read more

@Copyright 2024 by tradinglounge.com

Contact Us

Australian no: 02 4787 6020

International no: +61 (2) 47876020

Pay with:

Find us on