ASX: REA GROUP LTD – Elliott Wave Technical Analysis and Forecast

Introduction

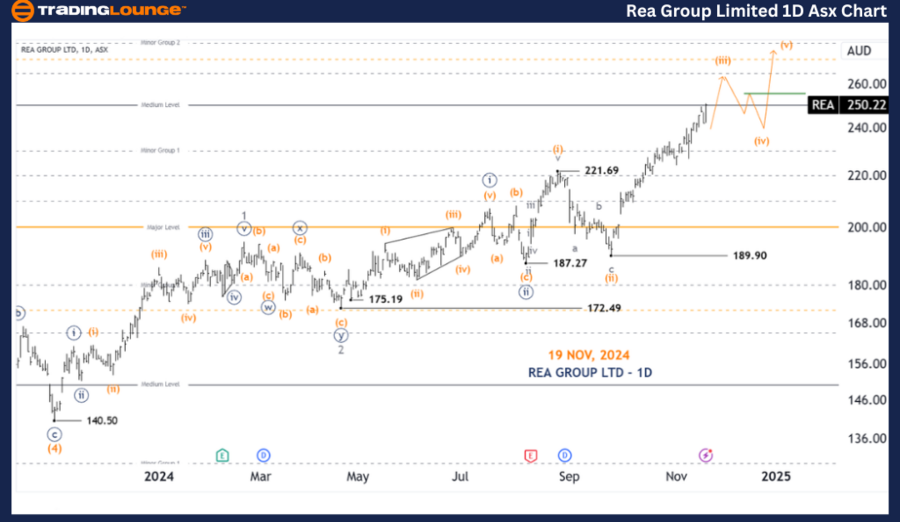
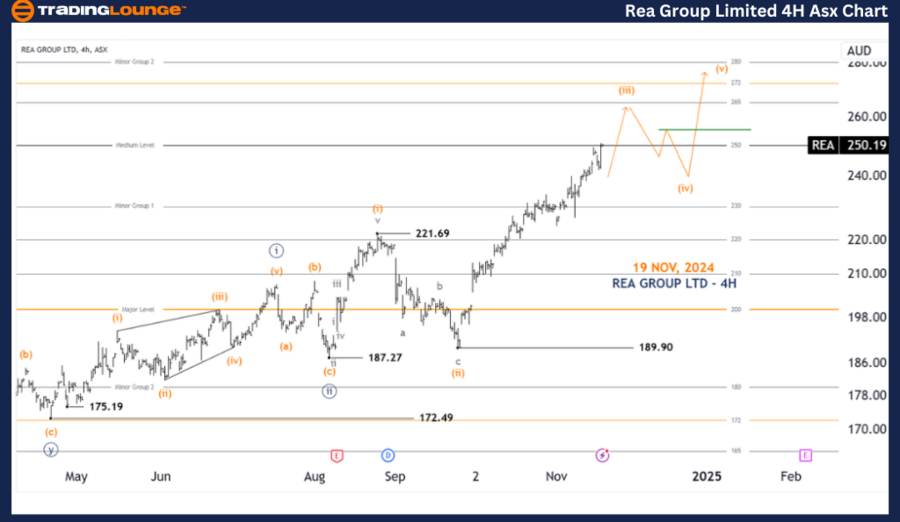
Welcome to today's Elliott Wave analysis for ASX: REA GROUP LTD (REA). Our focus is on providing an updated technical analysis using the Elliott Wave framework. Current observations suggest that REA.ASX is progressing within wave (iii), preparing for a pullback in wave (iv), before advancing further with wave (v). Below, we detail the analysis for both the daily and 4-hour charts to offer comprehensive insights.


ASX: REA GROUP LTD – REA 1D Chart (Semilog Scale) Analysis

Key Observations

REA Elliott Wave Technical Analysis

Function: Major trend (Minor degree, gray)

Mode: Motive

Structure: Impulse

Position: Wave (iii)-orange of Wave ((iii))-navy

Analysis Details

  • Wave (iii)-orange is advancing strongly from the level of 189.90.

  • The price is approaching the Medium Level of 250.00, indicating that the upside potential may soon become limited.
  • Once the level of 250.00 is reached, a pullback within wave (iv)-orange is anticipated.
  • Following the pullback, wave (v)-orange is expected to lead to new advances.
  • A key long trade setup emerges when the 250.00 level transitions into a tested support.

Invalidation Point: 221.69

REA-GROUP-LTD-1D-Asx...


ASX: REA GROUP LTD – REA 4-Hour Chart Analysis

Key Observations

Function: Major trend (Minuette degree, orange)

Mode: Motive

Structure: Impulse

Position: Wave (iii)-orange

Analysis Details

  • The 4-hour chart mirrors the 1D analysis, reinforcing the ongoing development within wave (iii)-orange.

  • A pullback with wave (iv)-orange remains expected.
  • Wave (v)-orange should follow, provided the price maintains its position above the key level of 221.69.

Invalidation Point: 221.69

Technical Analyst: Hua (Shane) Cuong, CEWA-M (Master’s Designation).

Source: visit Tradinglounge.com and learn From the Experts Join TradingLounge Here 

See Previous: TELSTRA GROUP LIMITED (TLS) Elliott Wave Technical Analysis 

VALUE Offer - Buy 1 Month & Get 3 Months!Click here

Access 7 Analysts Over 200 Markets Covered. Chat Room With Support

REA-GROUP-LTD-4h-Asx...


Conclusion

Our Elliott Wave analysis for ASX: REA GROUP LTD highlights the progression of the stock within wave (iii), with clear expectations for a pullback and subsequent advancement. Key price levels, including the invalidation point at 221.69 and the Medium Level at 250.00, offer critical guidance for traders. By leveraging these insights, investors can identify potential long trade setups and navigate market trends confidently. Our goal is to deliver precise and actionable forecasts to empower informed trading decisions.

Related

Cardano/ U.S. dollar(ADAUSD) Elliott Wave Technical Analysis 7 November 23

Cardano/ U.S. dollar(ADAUSD) Elliott Wave Technical Analysis 7 November 23

ADAUSD Crypto Analysis - Cardano/ U.S. dollar(ADAUSD) Elliott Wave Technical Analysis on 7 November ...

Read More >
KOSPI Composite Index Elliott Wave Technical Analysis: Indicates a Strong Bullish Trend with Significant Investment Potential

KOSPI Composite Index Elliott Wave Technical Analysis: Indicates a Strong Bullish Trend with Significant Investment Potential

The latest Elliott Wave analysis on the KOSPI Composite Index indicates a strong bullish trend with ...

Read More >
Cocoa Commodity Elliott Wave Technical Analysis: Navigating Current Trends and Future Possibilities

Cocoa Commodity Elliott Wave Technical Analysis: Navigating Current Trends and Future Possibilities

Discover the latest insights into the cocoa market with our in-depth Elliott Wave analysis. Learn ab...

Read More >
Bitcoin/U.S. dollar(BTCUSD) Elliott Wave Technical Analysis 29 January 24

Bitcoin/U.S. dollar(BTCUSD) Elliott Wave Technical Analysis 29 January 24

Bitcoin and U.S. dollar(BTCUSD) Elliott Wave Technical Analysis dated 29 January 24, Day and 4-hour ...

Read More >
S&P 500 Elliott Wave Analysis with Daily and Weekly Charts Highlighting Impulsive Trends, Wave Counts, and Market Forecasts

S&P 500 Elliott Wave Analysis with Daily and Weekly Charts Highlighting Impulsive Trends, Wave Counts, and Market Forecasts

S&P 500 Elliott Wave analysis on both daily and weekly timeframes. It outlines the current market po...

Read More >

$1 for 2 Weeks

then $29 a month!

What a Special Offer!

Trade Recommendations

Unleash the power of deversified trading with our comprehensive portfolio, covering 250+ markets:

  • Stock Trades
  • Crypto Trades
  • Forex Trades
  • Commodity Trades
Elliott Wave Analysis

Gain a competitive edge with expert insights and AI-powered Elliott Wave charting into:

  • Global Indices
  • US Stocks & ASX Stocks
  • Forex & Crypto
  • Commodities
Top-Notch Trading Tools

Equip yourself with the tools of success:

  • Real-time Chat rooms
  • Elliott Wave Algorithm
  • Portfolio tools
  • TradingLevels
  • Screener
  • Trading Game
7 Elliott Wave Analysts

Stay ahead of the market with daily charts and insightful videos
Your secret to strategic trading!

JOIN HERE


Welcome to TradingLounge (ASIC A.R.No. 321187), specialists in trades, trading education and technical analysis, covering stocks, indices, commodities, forex and cryptocurrencies.

When you join TradingLounge you have access to everything we offer, including trade tools, educational content and a social platform to chat with like-minded investors.

Read more

@Copyright 2024 by tradinglounge.com

Contact Us

Australian no: 02 4787 6020

International no: +61 (2) 47876020

Pay with:

Find us on