12Mar

Fisher & Paykel Healthcare (ASX: FPH) Elliott Wave Analysis: Is a Major Price Move Coming? Stock Forecast & Trading Insights!

ASX: FISHER & PAYKEL HEALTHCARE CORPORATION LIMITED (FPH) – TradingLounge (1D Chart)

Overview
Welcome to today’s Elliott Wave analysis for FISHER & PAYKEL HEALTHCARE CORPORATION LIMITED (ASX: FPH).

Currently, ASX: FPH shows no immediate signs of a bullish reversal, with further downside movement anticipated. This presents a strategic opportunity to monitor the stock’s corrective waves, which play a critical role in identifying potential motive wave formations for future price action.

FPH Elliott Wave Technical Analysis

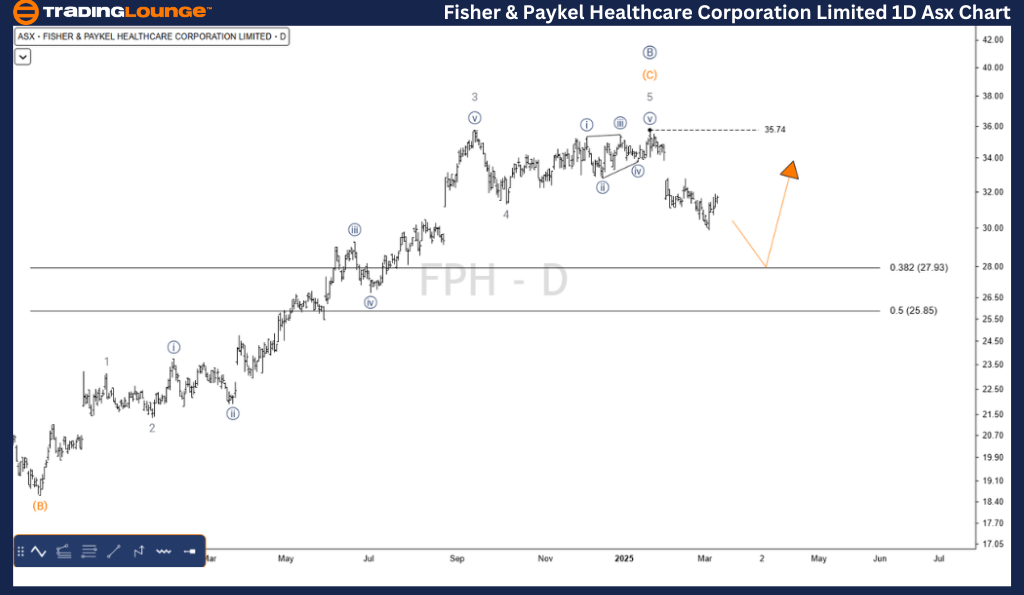
ASX: FISHER & PAYKEL HEALTHCARE CORPORATION LIMITED (FPH) Elliott Wave Technical Analysis – 1D Chart (Semilog Scale)

Function: Major Trend (Minor Degree – Grey)

Mode: Motive

Structure: Impulse

Position: Wave ((c)) – Navy

Analysis Details: The corrective wave structure appears to be unfolding as ((a))((b))((c)) – navy, with the ((b)) – navy wave likely reaching a peak at 35.74. Currently, Wave ((c)) – navy is in progress, though alternative wave counts may also be developing.

Regardless of the precise pattern, the price remains poised to push lower, with 27.93 identified as the next major support level.

Invalidation Point: 35.74

FISHER-&-PAYKEL-HEAL...


ASX: FPH Elliott Wave Technical Analysis – TradingLounge (4-Hour Chart)

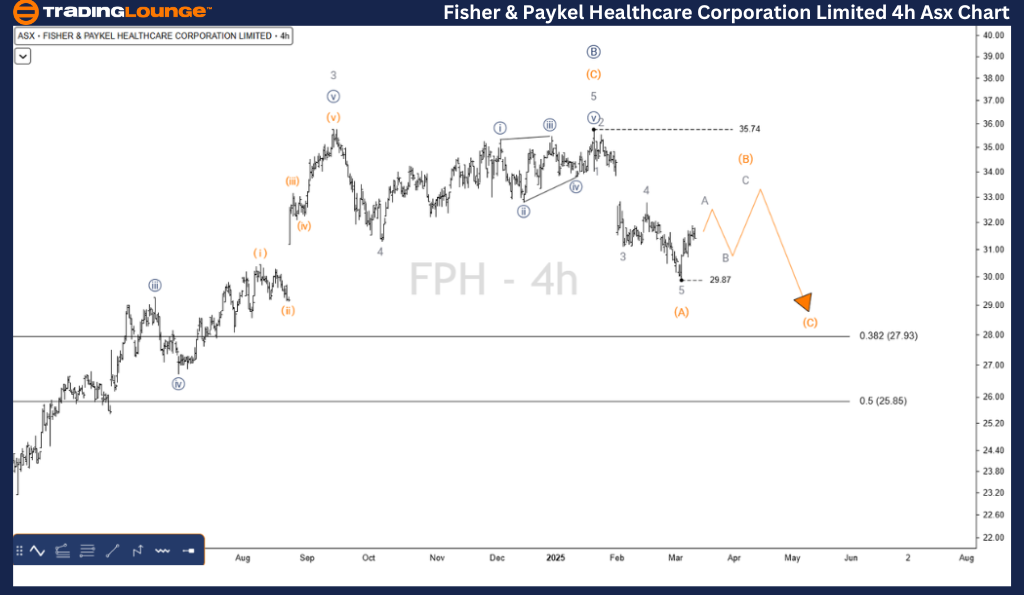
ASX: FPH Elliott Wave Technical Analysis – 4-Hour Chart

Function: Major Trend (Minute Degree – Navy)

Mode: Motive

Structure: Impulse

Position: Wave (B) – Orange of Wave ((c)) – Navy

Analysis Details: The Wave ((c)) – navy is actively progressing lower. The previous Wave (A) – orange completed a five-wave sequence, confirming its impulse structure.

Currently, Wave (B) – orange is forming a short-term corrective phase, likely preceding the continuation of Wave (C) – orange, which is expected to drive the price lower.

Invalidation Point: 35.74

Technical Analyst: Hua (Shane) Cuong, CEWA-M (Master’s Designation).

Source: visit Tradinglounge.com and learn From the Experts Join TradingLounge Here 

See Previous: INSURANCE AUSTRALIA GROUP LIMITED Elliott Wave Technical Analysis

VALUE Offer - Buy 1 Month & Get 3 Months!Click here

Access 7 Analysts Over 200 Markets Covered. Chat Room With Support

FISHER-&-PAYKEL-HEAL...


Conclusion

Our Elliott Wave analysis on FISHER & PAYKEL HEALTHCARE CORPORATION LIMITED (ASX: FPH) offers valuable insights into the current market structure and potential trading opportunities.

By establishing key validation and invalidation points, we enhance confidence in our wave counts, equipping traders with data-driven decision-making tools. Our goal is to maintain an objective and professional perspective on price trends, helping traders capitalize on potential market movements.

Related

Expert NASDAQ Index Elliott Wave Technical Analysis & NDX Analysis: Composite Top Trading Tips and Stock Picks

Expert NASDAQ Index Elliott Wave Technical Analysis & NDX Analysis: Composite Top Trading Tips and Stock Picks

Stay ahead in the market with this comprehensive guide to NASDAQ Composite trading and Elliott Wave ...

Read More >
 JPM Stocks Analysis: Understanding JP Morgan's (JPM) Market Dynamics through Elliott Wave Technical Analysis

JPM Stocks Analysis: Understanding JP Morgan's (JPM) Market Dynamics through Elliott Wave Technical Analysis

Dive into the dynamic world of JP Morgan Chase & Co. with a detailed Elliott Wave analysis that offe...

Read More >
Indian Stock Market Update on OIL & NATURAL Gas Co. Stock Analysis: ONGC Elliott Wave Technical Analysis & Price Prediction

Indian Stock Market Update on OIL & NATURAL Gas Co. Stock Analysis: ONGC Elliott Wave Technical Analysis & Price Prediction

Discover comprehensive ONGC stock analysis featuring Elliott Wave forecasts, technical analysis, and...

Read More >
Polkadot/U.S. dollar(DOTUSD) Elliott Wave Technical Analysis 1 February 24

Polkadot/U.S. dollar(DOTUSD) Elliott Wave Technical Analysis 1 February 24

TradingLounge Polkadot technical analysis today using Polkadot/US dollar(DOTUSD) Elliott Wave Analys...

Read More >
Uncover key validation points to boost your trading confidence: ASX Limited Elliott Wave Technical Analysis

Uncover key validation points to boost your trading confidence: ASX Limited Elliott Wave Technical Analysis

Our comprehensive Elliott Wave analysis provides an in-depth look at ASX LIMITED on the Australian S...

Read More >
Gold (XAUUSD) Price Forecast 2024: Elliott Wave Insights, Bullish Trends, Key Levels, and Market Outlook for Smart Investment Decisions

Gold (XAUUSD) Price Forecast 2024: Elliott Wave Insights, Bullish Trends, Key Levels, and Market Outlook for Smart Investment Decisions

Gold is set to continue its bullish trend as Elliott Wave analysis highlights key levels and forecas...

Read More >

Buy 1 Month

Get 3 Months!

Special Offer:

Trade Recommendations

Unleash the power of deversified trading with our comprehensive portfolio, covering:

  • Stock Trades
  • Crypto Trades
  • Forex Trades
  • Commodity Trades
Elliott Wave Analysis

Gain a competive edge with expert insights in to:

  • Global Indices
  • US Stocks & ASX Stocks
  • Forex & Crypto
  • Commodities
Top-Notch Trading Tools

Equip yourself with the tools of success:

  • Social Chat
  • Elliott Wave Algorithm
  • Screener
  • TradingLevels
  • Trading Game
7 Elliott Wave Analysts

Stay ahead of the market with daily charts and insightful videos
-Your secret to strategic trading!

JOIN HERE


Welcome to TradingLounge (ASIC A.R.No. 321187), specialists in trades, trading education and technical analysis, covering stocks, indices, commodities, forex and cryptocurrencies.

When you join TradingLounge you have access to everything we offer, including trade tools, educational content and a social platform to chat with like-minded investors.

Read more

@Copyright 2024 by tradinglounge.com

Contact Us

Australian no: 02 4787 6020

International no: +61 (2) 47876020

Pay with:

Find us on