29Oct

COST Moves Within a Bullish Wave Structure and Forecast for Traders and Investors: Costco Wholesale Corp. Stock Elliott Wave Analysis

COST Elliott Wave Analysis: Forecasting Trends in Costco Wholesale Corp. (COST)

In this Elliott Wave analysis, we examine the trend structure of Costco Wholesale Corp. (COST) using daily and 1-hour charts to analyze the current wave position and potential price movements.

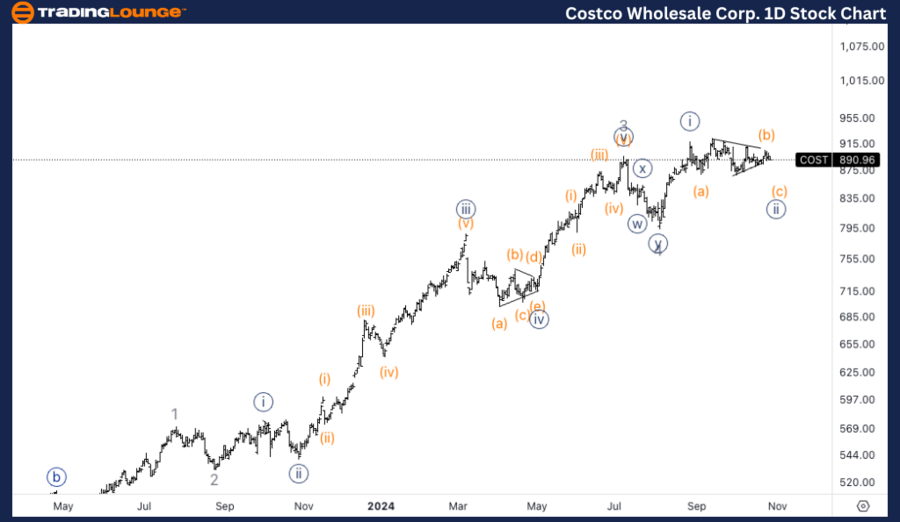
COST Elliott Wave Analysis – Trading Lounge Daily Chart

Costco Wholesale Corp. (COST) Daily Chart Analysis

COST Elliott Wave Technical Analysis

Function: Trend

Mode: Impulsive

Structure: Motive

Position: Wave 5 of (5)

Direction: Upside in wave 5

Details: We anticipate a continuation higher within wave 5 of (5), with the next key resistance level near the Trading Level at $1000, a potential psychological threshold.

COST Elliott Wave Technical Analysis – Daily Chart

On the daily chart, COST is advancing within wave 5 of (5), which marks the final leg in this bullish trend. The next major resistance level is expected around the Trading Level at $1000. This price level could act as a significant barrier, given its psychological influence. The broader trend remains bullish as the price approaches this critical resistance zone.

Costco-Wholesale-Cor...


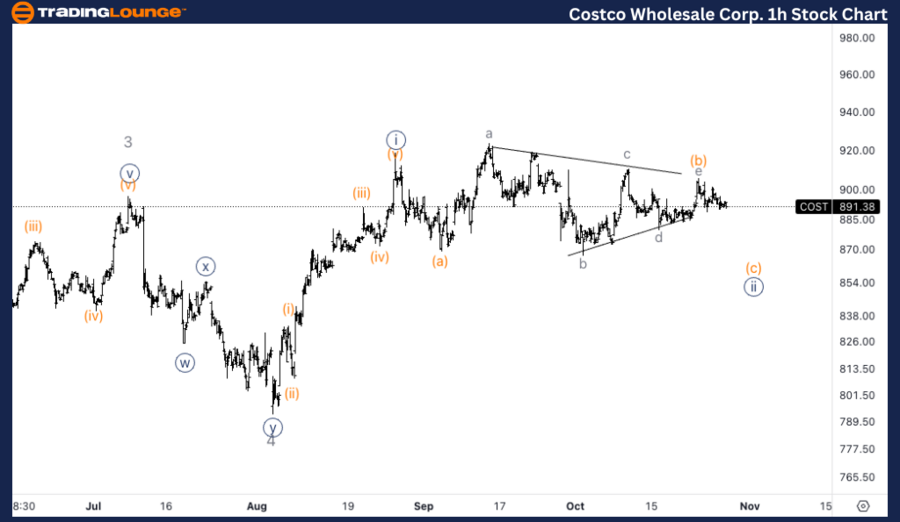
Costco Wholesale Corp. (COST) 1-Hour Chart

COST Elliott Wave Technical Analysis

Function: Trend

Mode: Impulsive

Structure: Motive

Position: Wave (c) of {ii}

Direction: Downside in wave (c)

Details: The formation of a triangle within wave (b) of {ii} suggests a potential move lower in wave (c) to complete the correction phase. A support zone around $850 could serve as a possible base.

COST Elliott Wave Technical Analysis – 1H Chart

On the 1-hour chart, COST appears to be in the corrective phase of wave {ii}, particularly in wave (c). The development of a triangle in wave (b) suggests one more leg down in wave (c), which could complete the overall correction. Support near the $850 mark is an important level to watch, as it could serve as a launch point for the next upward trend leg.

Technical Analyst: Alessio Barretta

Source: visit Tradinglounge.com and learn From the Experts Join TradingLounge Here 

See Previous: JP Morgan & Chase Co Elliott Wave Technical Analysis

VALUE Offer - Buy 1 Month & Get 3 Months!Click here

Access 7 Analysts Over 200 Markets Covered. Chat Room With Support

Costco-Wholesale-Cor...

Related

Caterpillar Inc., (CAT) U.S. Stocks Elliott Wave Technical Analysis: Detailed Chart Analysis for Bullish Trend and Price Targets

Caterpillar Inc., (CAT) U.S. Stocks Elliott Wave Technical Analysis: Detailed Chart Analysis for Bullish Trend and Price Targets

This analysis of Caterpillar (CAT) applies Elliott Wave Theory to both daily and 1-hour charts, high...

Read More >
Analog Devices Inc.(ADI:NASDAQ) Elliott Wave Technical Analysis 29 November 23

Analog Devices Inc.(ADI:NASDAQ) Elliott Wave Technical Analysis 29 November 23

Analog Devices Inc.(ADI: NASDAQ) Elliott Wave Technical Analysis dated 29 November 23, Analog Device...

Read More >
Cochlear Limited Stock Forecast: Elliott Wave Technical Analysis of ASX:COH Reveals Bullish Impulse Setup and Price Targets Ahead

Cochlear Limited Stock Forecast: Elliott Wave Technical Analysis of ASX:COH Reveals Bullish Impulse Setup and Price Targets Ahead

This article presents a professional Elliott Wave analysis for Cochlear Limited (ASX: COH), focusing...

Read More >
S&P/TSX 60 Index Elliott Wave Analysis: Market Trends, Forecast, Market Movements with this Comprehensive Technical Analysis

S&P/TSX 60 Index Elliott Wave Analysis: Market Trends, Forecast, Market Movements with this Comprehensive Technical Analysis

This analysis provides a detailed Elliott Wave forecast for the S&P/TSX 60 index, covering the lates...

Read More >
Dr Reddy Laboratories Share Forecast and Elliott Wave Analysis Signals Bullish Trend, Buy Zones, and Key Price Levels for Traders

Dr Reddy Laboratories Share Forecast and Elliott Wave Analysis Signals Bullish Trend, Buy Zones, and Key Price Levels for Traders

This analysis provides a detailed Elliott Wave outlook for Dr Reddy Laboratories, indicating a bulli...

Read More >

$1 for 2 Weeks

then $29 a month!

What a Special Offer!

Trade Recommendations

Unleash the power of deversified trading with our comprehensive portfolio, covering 250+ markets:

  • Stock Trades
  • Crypto Trades
  • Forex Trades
  • Commodity Trades
Elliott Wave Analysis

Gain a competitive edge with expert insights and AI-powered Elliott Wave charting into:

  • Global Indices
  • US Stocks & ASX Stocks
  • Forex & Crypto
  • Commodities
Top-Notch Trading Tools

Equip yourself with the tools of success:

  • Real-time Chat rooms
  • Elliott Wave Algorithm
  • Portfolio tools
  • TradingLevels
  • Screener
  • Trading Game
7 Elliott Wave Analysts

Stay ahead of the market with daily charts and insightful videos
Your secret to strategic trading!

JOIN HERE


Welcome to TradingLounge (ASIC A.R.No. 321187), specialists in trades, trading education and technical analysis, covering stocks, indices, commodities, forex and cryptocurrencies.

When you join TradingLounge you have access to everything we offer, including trade tools, educational content and a social platform to chat with like-minded investors.

Read more

@Copyright 2024 by tradinglounge.com

Contact Us

Australian no: 02 4787 6020

International no: +61 (2) 47876020

Pay with:

Find us on