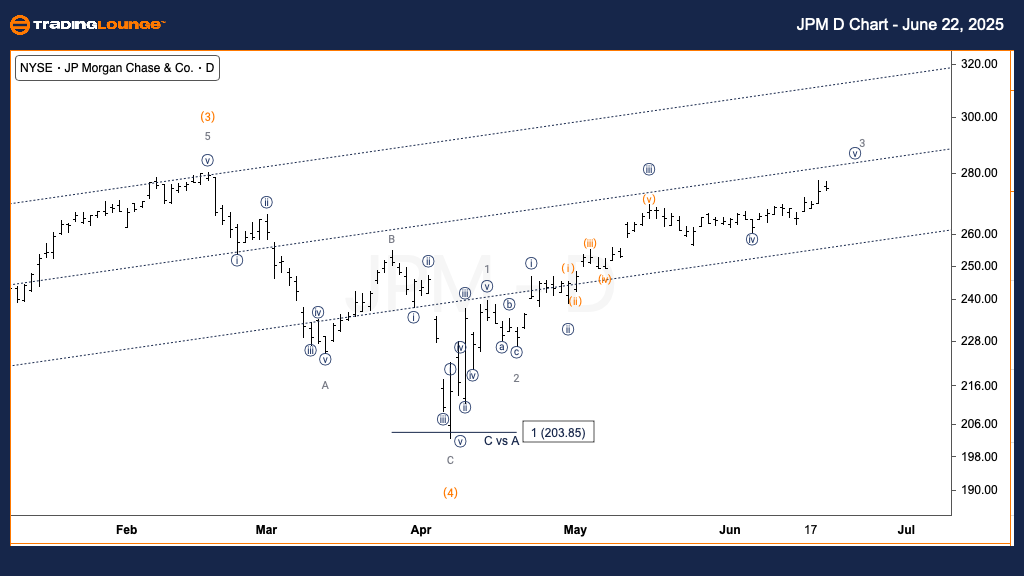
JP Morgan & Chase Co. (JPM) Elliott Wave Forecast - Tradinglounge Daily Chart
JP Morgan & Chase Co. (JPM) Daily Chart Analysis
JP Morgan & Chase Co. (JPM) Elliott Wave Forecast
FUNCTION: Trend
MODE: Impulsive
STRUCTURE: Motive
POSITION: Wave {v} of 3
DIRECTION: Upward move in wave {v}
DETAILS: JP Morgan stock (JPM) is trading within MinorGroup2, around the $265 level. A bullish continuation appears likely, targeting the $280 region. This stage likely represents the final leg of wave {v} of 3, potentially preceding a broader market correction.
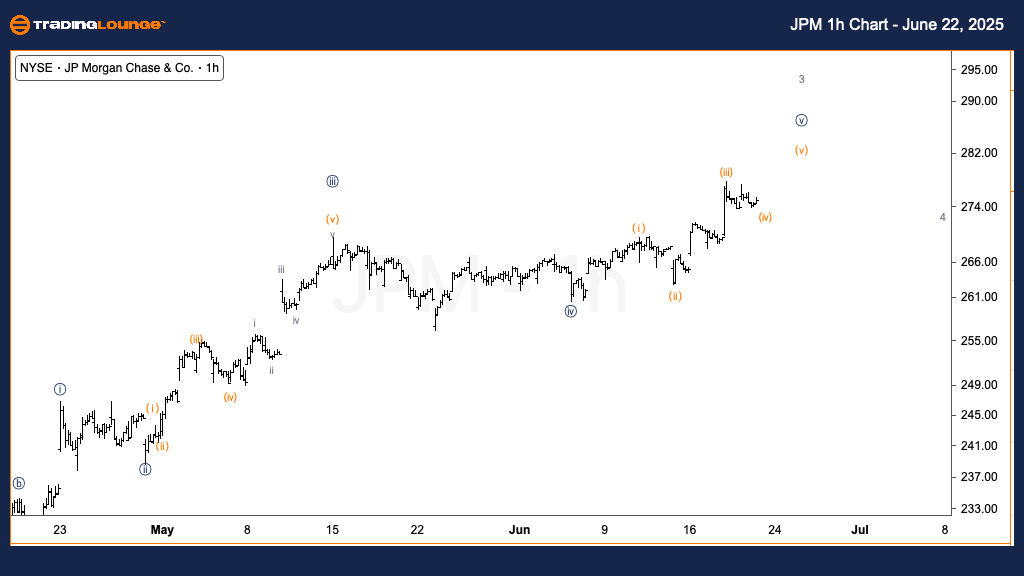
JP Morgan & Chase Co. (JPM) Elliott Wave Forecast - Tradinglounge 1-Hour Chart
JP Morgan & Chase Co. (JPM) 1H Chart Analysis
FUNCTION: Trend
MODE: Impulsive
STRUCTURE: Motive
POSITION: Wave (iv) of {v}
DIRECTION: Upward continuation into wave (v)
DETAILS: On the intraday chart, JPM is developing wave (iv) of {v}, suggesting further upside to complete wave (v). This would finalize the internal 5-wave pattern and confirm the daily bullish Elliott Wave structure.
Technical Analyst: Alessio Barretta
Source: Visit Tradinglounge.com and learn from the Experts. Join TradingLounge Here
Previous: QUALCOMM Inc. (QCOM) Elliott Wave Technical Analysis
VALUE Offer - $1 for 2 Weeks then $29 a month!Click here
Access 7 Analysts Over 200 Markets Covered. Chat Room With Support