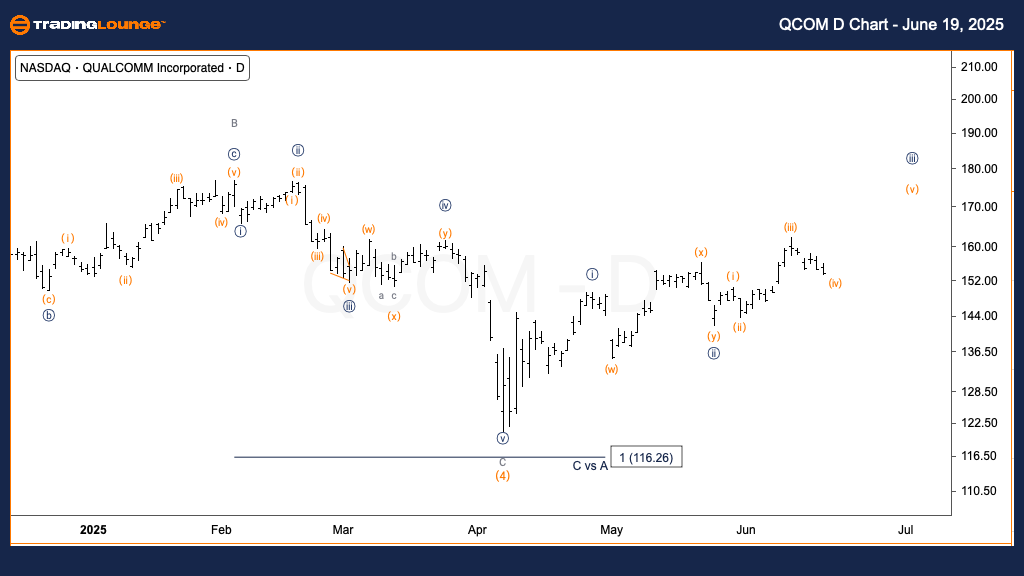
QCOM Elliott Wave Analysis – Trading Lounge Daily Chart
QUALCOMM Inc. (QCOM) Daily Chart Analysis
QCOM Elliott Wave Technical Analysis
FUNCTION: Trend
MODE: Impulsive
STRUCTURE: Motive
POSITION: Wave {iii} of 1
DIRECTION: Upward movement expected in wave {iii}
DETAILS: Price action holds near the $150 MediumLevel support, with further growth projected in minute wave {iii}
QCOM Stock Elliott Wave Forecast – Daily Chart Overview
The Elliott Wave outlook for QUALCOMM Inc. (QCOM) on the daily timeframe remains bullish. The stock is currently advancing within minute wave {iii} of the larger wave 1, indicating continued upside potential. With the price consolidating around the $150 MediumLevel, bullish momentum persists. A breakout above recent resistance levels would validate the next leg of wave {iii}, targeting sustained gains in the near-to-mid term.
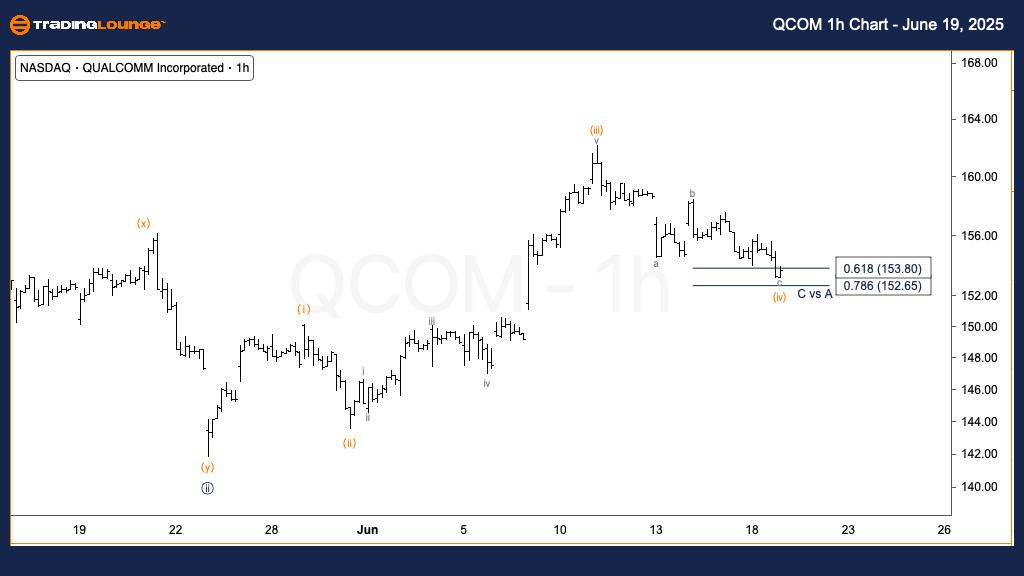
QUALCOMM Inc. (QCOM) US Stock 1H Chart Analysis
QCOM Elliott Wave Technical Analysis
FUNCTION: Trend
MODE: Impulsive
STRUCTURE: Motive
POSITION: Wave (iv) of {iii}
DIRECTION: Bottom likely forming in wave (iv)
DETAILS: Five-wave rally in wave (iii) now transitioning into a typical three-wave correction as wave (iv)
QCOM Hourly Elliott Wave Forecast – Short-Term Analysis
On the 1-hour chart, QCOM displays a completed five-wave advance in wave (iii), followed by a corrective phase labeled as wave (iv). This move is unfolding as a standard three-wave pattern, commonly observed in Elliott Wave corrections. Traders are monitoring for signs of a bottom in wave (iv), which could lead to the start of wave (v). If upward momentum resumes, QCOM is likely to break above recent highs and continue its current bullish trend.
Technical Analyst: Alessio Barretta
Source: Visit Tradinglounge.com and learn from the Experts. Join TradingLounge Here
Previous: Caterpillar Inc. (CAT) Elliott Wave Technical Analysis
VALUE Offer - $1 for 2 Weeks then $29 a month!Click here
Access 7 Analysts Over 200 Markets Covered. Chat Room With Support