BHARAT ELECTRONICS Elliott Wave Analysis | Trading Lounge Daily Chart
BHARAT ELECTRONICS Daily Chart Analysis
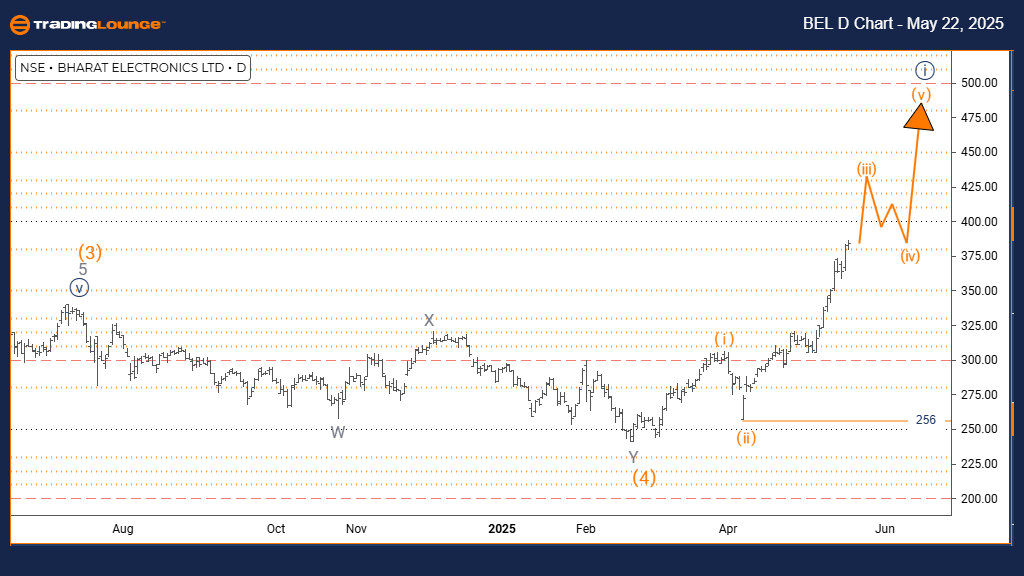
BHARAT ELECTRONICS Elliott Wave Technical Forecast
FUNCTION: Bullish Trend
MODE: Impulsive
STRUCTURE: Orange Wave 3
POSITION: Navy Blue Wave 1
NEXT LOWER DEGREE DIRECTION: Orange Wave 4
KEY DETAILS: Orange Wave 2 has completed; Orange Wave 3 is active. Invalidation level set at 256.
The daily chart for Bharat Electronics reveals a strong bullish trend supported by Elliott Wave analysis. The current wave structure places the stock in Orange Wave 3, nested within a broader Navy Blue Wave 1. This transition from corrective Orange Wave 2 to impulsive Orange Wave 3 signals robust upward momentum in BEL stock price.
Wave analysis confirms the end of Orange Wave 2 and the progression of a classic Elliott impulsive wave. This movement typically accompanies increased buying pressure and strong price advances. The bullish setup remains intact above the invalidation level at 256, which serves as a technical safeguard. A break below this threshold would imply a potential shift into a more complex corrective pattern or even a trend reversal.
This wave count offers essential insights for traders analyzing Bharat Electronics share price trends. The continuation of this impulse phase suggests potential gains until Orange Wave 4 correction begins. Active monitoring of the stock is advised to capture ongoing trend developments.
While the structure favors further upside, prudent risk management remains crucial. The 256 level remains a critical technical point to validate the ongoing bullish wave pattern.
BHARAT ELECTRONICS Elliott Wave Analysis | Trading Lounge Weekly Chart
BHARAT ELECTRONICS Long-Term Technical Forecast
FUNCTION: Bullish Trend
MODE: Impulsive
STRUCTURE: Navy Blue Wave 1
POSITION: Gray Wave 1
NEXT LOWER DEGREE DIRECTION: Navy Blue Wave 2
KEY DETAILS: Navy Blue Wave 1 within Gray Wave 1 is developing. Invalidation level is 256.
The weekly chart of Bharat Electronics highlights the emergence of a new bullish cycle. Elliott Wave analysis identifies Navy Blue Wave 1 within Gray Wave 1, marking the early phase of a potential long-term uptrend. This setup indicates that BEL stock may be entering a significant upward trajectory.
Currently in the Navy Blue Wave 1 stage, the stock shows impulsive characteristics indicative of early trend strength. Such early-stage waves often align with major upward price movements, supported by increasing buying volume. The invalidation level of 256 remains pivotal; a drop below this level would cast doubt on the bullish scenario.
This wave analysis provides investors with a clearer view of Bharat Electronics’ long-term growth potential. While the structure suggests more upside, the upcoming corrective phase (Navy Blue Wave 2) should be anticipated once this impulsive leg concludes.
Investors are encouraged to track market behavior closely, especially price reactions around the 256 level. The broader technical picture points to sustained growth, with the Elliott Wave structure supporting continued bullish sentiment in BEL stock forecasts.
Technical Analyst: Malik Awais
Source: Visit Tradinglounge.com and learn from the Experts. Join TradingLounge Here
Previous: NESTLE INDIA Elliott Wave Technical Analysis
VALUE Offer - Buy 1 Month & Get 3 Months!Click here
Access 7 Analysts Over 200 Markets Covered. Chat Room With Support
