MCD Elliott Wave Analysis Trading Lounge Daily Chart

In this Elliott Wave analysis report, we delve into the movements of McDonald's Corp. (MCD) on both its daily and 4-hour charts, aiming to provide insights for stock traders and investors.

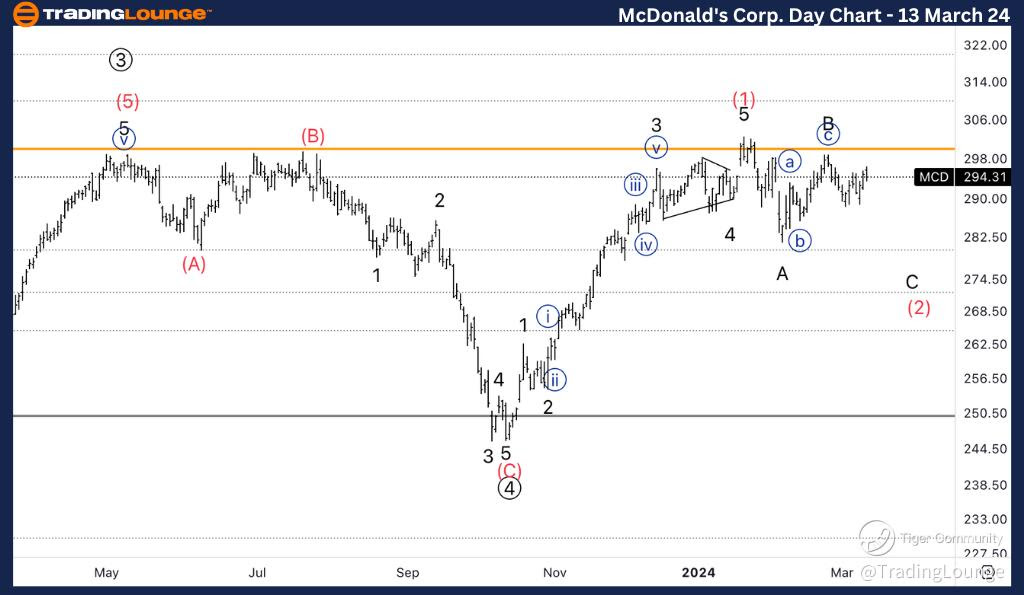
McDonald's Corp. (MCD) Daily Chart Analysis

MCD Elliott Wave Technical Analysis

Function: Counter Trend

Mode: Corrective

Structure: Flat

Position: Wave (2) of 3

Direction: Downside into wave C of (2)

After achieving an all-time high (ATH) at $300, McDonald's Corp. (MCD) experienced a pullback, which exhibits characteristics of a bullish corrective phase. This suggests a potential for a continuation higher once the pullback concludes.

MCD-day-stock-chart-...


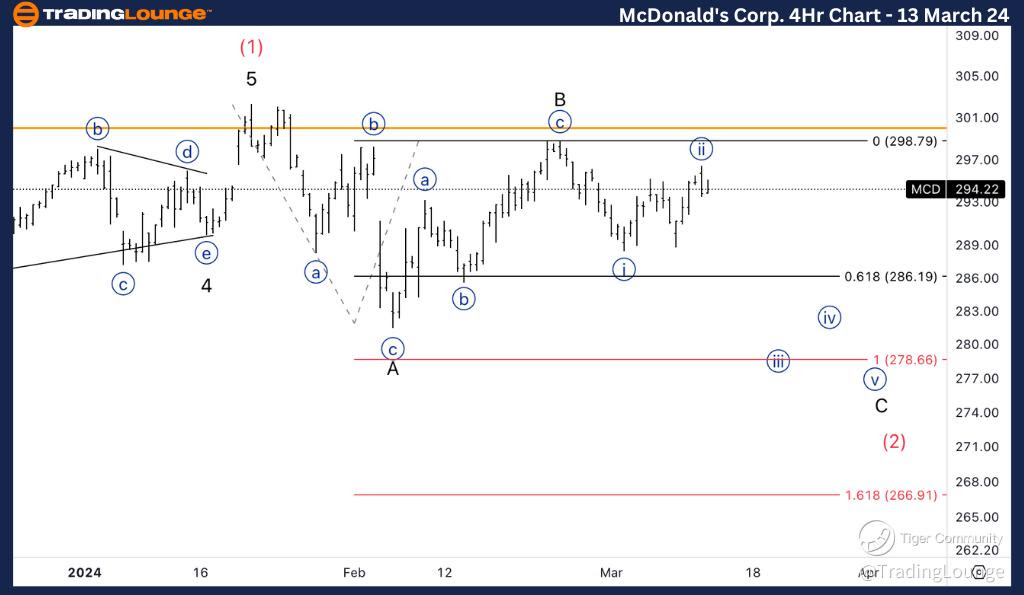
MCD Elliott Wave Analysis Trading Lounge 4Hr Chart, 13 March 24

McDonald's Corp. (MCD) 4Hr Chart Analysis

MCD Elliott Wave Technical Analysis

Function: Counter Trend

Mode: Corrective

Structure: Flat

Position: Wave C of (2)

Direction: Wave {iii} of C

On the 4-hour chart, we observe the progression of wave C of (2). Our analysis indicates a downside movement into wave {iii}, with a possibility of encountering a sideways wave B before the downward momentum resumes.

Key Takeaways for Traders

  • McDonald's Corp. (MCD) is currently undergoing a corrective phase.
  • Daily chart analysis suggests a bullish continuation following the completion of the pullback.
  • On the 4-hour chart, wave C of (2) is in progress, with potential for a downward movement in wave {iii} of C.

Conclusion

Elliott Wave analysis offers valuable insights into the potential future movements of McDonald's Corp. (MCD). Traders and investors can use this analysis to make informed decisions, keeping an eye on the completion of the corrective phases and potential opportunities for entry or exit.

By staying updated with the Elliott Wave patterns, traders can navigate the market with enhanced precision and confidence, optimizing their trading strategies for better outcomes in the dynamic landscape of McDonald's Corp. (MCD) stock.

Technical Analyst: Alessio Barretta

Source: visit Tradinglounge.com and learn From the Experts Join TradingLounge Here 

See Previous: Exxon Mobil Corp., (XOM)

TradingLounge Once Off SPECIAL DEAL: Here > 1 month Get 3 months.

MCD-4Hr-stock-chart-...

Related

British Pound/ Australian Dollar(GBPAUD) Elliott Wave Technical Analysis 8 November 23

British Pound/ Australian Dollar(GBPAUD) Elliott Wave Technical Analysis 8 November 23

GBPAUD Elliott Wave Analysis Trading Lounge Day and 4-hour Chart for 8 November 23, delves into the ...

Read More >
Forex Market Movement and Trading Decisions With Our in-depth U.S. Dollar /Swiss Franc (USDCHF) Elliott Wave Technical Analysis

Forex Market Movement and Trading Decisions With Our in-depth U.S. Dollar /Swiss Franc (USDCHF) Elliott Wave Technical Analysis

Our in-depth USDCHF Elliott Wave Analysis covers daily and 4-hour charts, highlighting key trends, i...

Read More >
S&P/TSX 60 Elliott Wave Analysis: Technical Market Trends, Trading Insights, Stock Forecast & Risk Management

S&P/TSX 60 Elliott Wave Analysis: Technical Market Trends, Trading Insights, Stock Forecast & Risk Management

Elliott Wave Analysis of the S&P/TSX 60 index provides key insights into market trends, corrective p...

Read More >
 ASX Trading Potential: BHP GROUP LIMITED - Elliott Wave Technical Analysis & Technical Forecast

ASX Trading Potential: BHP GROUP LIMITED - Elliott Wave Technical Analysis & Technical Forecast

Our detailed ASX: BHP GROUP LIMITED analysis explores Elliott Wave patterns and technical insights t...

Read More >
Stay updated with the latest price forecasts with Natural Gas Commodity Elliott Wave Technical Analysis

Stay updated with the latest price forecasts with Natural Gas Commodity Elliott Wave Technical Analysis

Explore our comprehensive analysis of natural gas prices using Elliott Wave theory. Understand marke...

Read More >
Dogecoin/ U.S. dollar(DOGEUSD) Elliott Wave Technical Analysis 30 November 23

Dogecoin/ U.S. dollar(DOGEUSD) Elliott Wave Technical Analysis 30 November 23

Dogecoin / U.S. dollar(DOGEUSD) Elliott Wave Technical Analysis On 30 November 23, Elliott Wave Anal...

Read More >

$1 for 2 Weeks

then $29 a month!

What a Special Offer!

Trade Recommendations

Unleash the power of deversified trading with our comprehensive portfolio, covering 250+ markets:

  • Stock Trades
  • Crypto Trades
  • Forex Trades
  • Commodity Trades
Elliott Wave Analysis

Gain a competitive edge with expert insights and AI-powered Elliott Wave charting into:

  • Global Indices
  • US Stocks & ASX Stocks
  • Forex & Crypto
  • Commodities
Top-Notch Trading Tools

Equip yourself with the tools of success:

  • Real-time Chat rooms
  • Elliott Wave Algorithm
  • Portfolio tools
  • TradingLevels
  • Screener
  • Trading Game
7 Elliott Wave Analysts

Stay ahead of the market with daily charts and insightful videos
Your secret to strategic trading!

JOIN HERE


Welcome to TradingLounge (ASIC A.R.No. 321187), specialists in trades, trading education and technical analysis, covering stocks, indices, commodities, forex and cryptocurrencies.

When you join TradingLounge you have access to everything we offer, including trade tools, educational content and a social platform to chat with like-minded investors.

Read more

@Copyright 2024 by tradinglounge.com

Contact Us

Australian no: 02 4787 6020

International no: +61 (2) 47876020

Pay with:

Find us on