12Mar

XOM Elliott Wave Technical Analysis: Unveiling Potential Upside Momentum in Exxon Mobil Corp. (XOM)

XOM Elliott Wave Analysis Trading Lounge Daily Chart

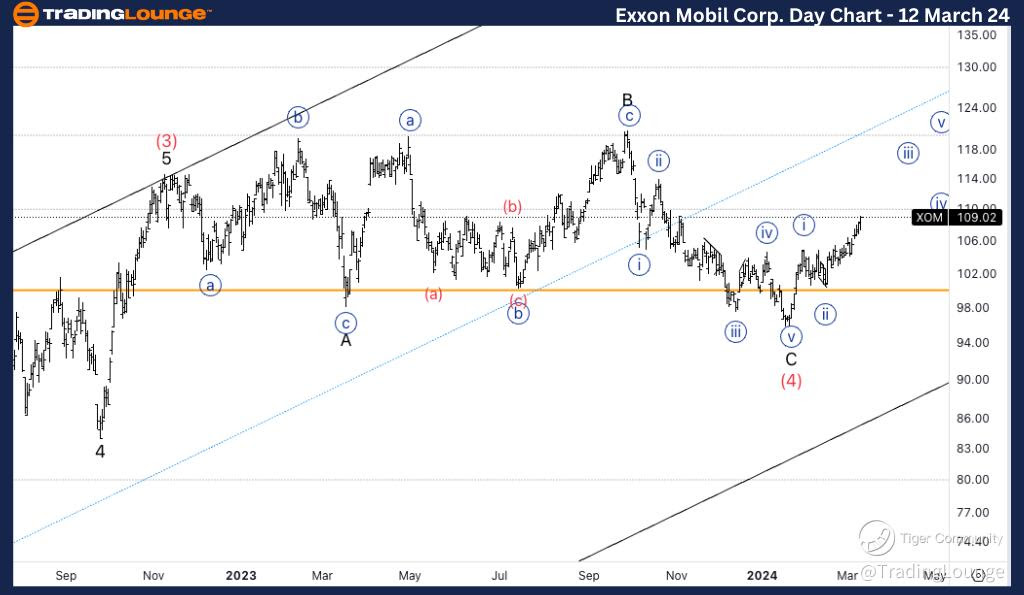
Welcome to our XOM Elliott Wave Analysis Trading Lounge, your go-to source for comprehensive insights into Exxon Mobil Corp. (XOM) using Elliott Wave Technical Analysis. Let's delve into the market dynamics as of the Daily Chart on 12 March 24.

Exxon Mobil Corp., (XOM) Daily Chart Analysis

XOM Elliott Wave Technical Analysis

FUNCTION: Trend

MODE: Impulsive

STRUCTURE: Motive

POSITION: Minor 1 of (5).

DIRECTION: Five waves up into wave 1.  

DETAILS: We have seen a long-lasting correction in what could be wave (4), and we have now found support on 100$.

In our analysis, we identify a trending function characterized by an impulsive mode and a motive structure. Positioned in Minor wave 1 of (5), our focus lies on the completion of five waves up into wave 1. Notably, we have observed a prolonged correction, potentially indicating wave (4), with support found at $100.

XOM-day-stock-chart-...


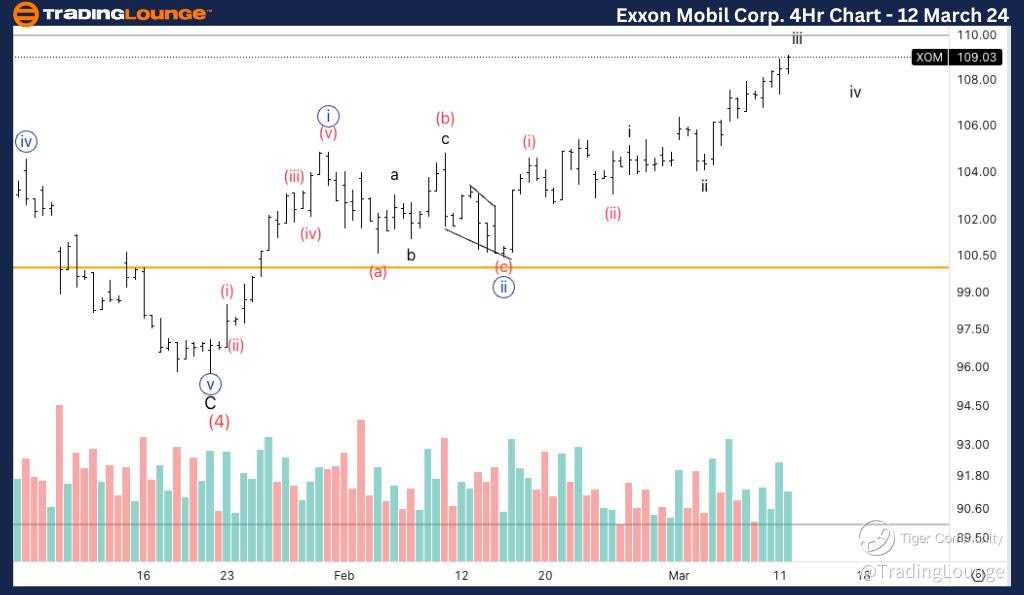
XOM Elliott Wave Analysis Trading Lounge 4Hr Chart, 12 March 24

Exxon Mobil Corp., (XOM) 4Hr Chart Analysis

XOM Elliott Wave Technical Analysis

FUNCTION: Trend

MODE: Impulsive

STRUCTURE: Motive  

POSITION: Wave (iii) of {iii}.

DIRECTION: Completion in wave iii of (iii).

DETAILS: We are looking at acceleration higher, as we the move up starts to become parabolic. We are also seeing increasing volume on the most recent move higher suggesting more buyers are stepping into the market.

Here, we also observe a trending function marked by an impulsive mode and a motive structure. Positioned in Wave (iii) of {iii}, our attention is on the completion of wave iii of (iii). Noteworthy is the acceleration in the upward movement, with the trajectory beginning to exhibit a parabolic shape. Moreover, the recent surge in volume suggests an increasing number of buyers entering the market, further bolstering the bullish sentiment.

Technical Analyst: Alessio Barretta

Source: visit Tradinglounge.com and learn From the Experts Join TradingLounge Here 

See Previous: Apple Inc. (AAPL)

TradingLounge Once Off SPECIAL DEAL: Here > 1 month Get 3 months.

XOM-4Hr-stock-chart-...

Related

GBPUSD Bullish Trend: Elliott Wave Technical Analysis & Expert Forex Trading Strategies

GBPUSD Bullish Trend: Elliott Wave Technical Analysis & Expert Forex Trading Strategies

Get detailed insights into the GBPUSD market with this Elliott Wave analysis, focusing on the curren...

Read More >
Explore the ASX Trading Success: REECE LIMITED – REH Stock Analysis & Elliott Wave Technical Forecast

Explore the ASX Trading Success: REECE LIMITED – REH Stock Analysis & Elliott Wave Technical Forecast

Explore the potential future movements of Reece Limited (REH) on the ASX through detailed Elliott Wa...

Read More >
ASX LIMITED Elliott Wave Technical Analysis: Price Movement Trends, and Trading Strategy for Market Trends

ASX LIMITED Elliott Wave Technical Analysis: Price Movement Trends, and Trading Strategy for Market Trends

Elliott Wave forecast for ASX LIMITED (ASX: ASX), outlining key technical trends, price targets, and...

Read More >
ASX Trading Success: BLOCK, INC – XYZ Elliott Wave Analysis & Elliott Wave Technical Forecast in the Australian Stock Market

ASX Trading Success: BLOCK, INC – XYZ Elliott Wave Analysis & Elliott Wave Technical Forecast in the Australian Stock Market

Our ASX: BLOCK INC Elliott Wave analysis provides an in-depth look at the current stock trend, ident...

Read More >
Swiss Market Index Elliott Wave Technical Analysis: Bullish Orange Wave 3 Insights and Market Projections

Swiss Market Index Elliott Wave Technical Analysis: Bullish Orange Wave 3 Insights and Market Projections

The Swiss Market Index (SMI) is in a bullish impulsive phase as analyzed through Elliott Wave Theory...

Read More >
Elliott Wave Techniacl Analysis for Berkshire Hathaway Inc. (BRK:B): Daily and 1-Hour Chart Insights to Predict Stock Price Movements

Elliott Wave Techniacl Analysis for Berkshire Hathaway Inc. (BRK:B): Daily and 1-Hour Chart Insights to Predict Stock Price Movements

Elliott Wave analysis examines the daily and 1-hour charts of Berkshire Hathaway (BRK.B) and Visa In...

Read More >

$1 for 2 Weeks

then $29 a month!

What a Special Offer!

Trade Recommendations

Unleash the power of deversified trading with our comprehensive portfolio, covering 250+ markets:

  • Stock Trades
  • Crypto Trades
  • Forex Trades
  • Commodity Trades
Elliott Wave Analysis

Gain a competitive edge with expert insights and AI-powered Elliott Wave charting into:

  • Global Indices
  • US Stocks & ASX Stocks
  • Forex & Crypto
  • Commodities
Top-Notch Trading Tools

Equip yourself with the tools of success:

  • Real-time Chat rooms
  • Elliott Wave Algorithm
  • Portfolio tools
  • TradingLevels
  • Screener
  • Trading Game
7 Elliott Wave Analysts

Stay ahead of the market with daily charts and insightful videos
Your secret to strategic trading!

JOIN HERE


Welcome to TradingLounge (ASIC A.R.No. 321187), specialists in trades, trading education and technical analysis, covering stocks, indices, commodities, forex and cryptocurrencies.

When you join TradingLounge you have access to everything we offer, including trade tools, educational content and a social platform to chat with like-minded investors.

Read more

@Copyright 2024 by tradinglounge.com

Contact Us

Australian no: 02 4787 6020

International no: +61 (2) 47876020

Pay with:

Find us on