Eli Lilly & Co., Elliott Wave Technical Analysis
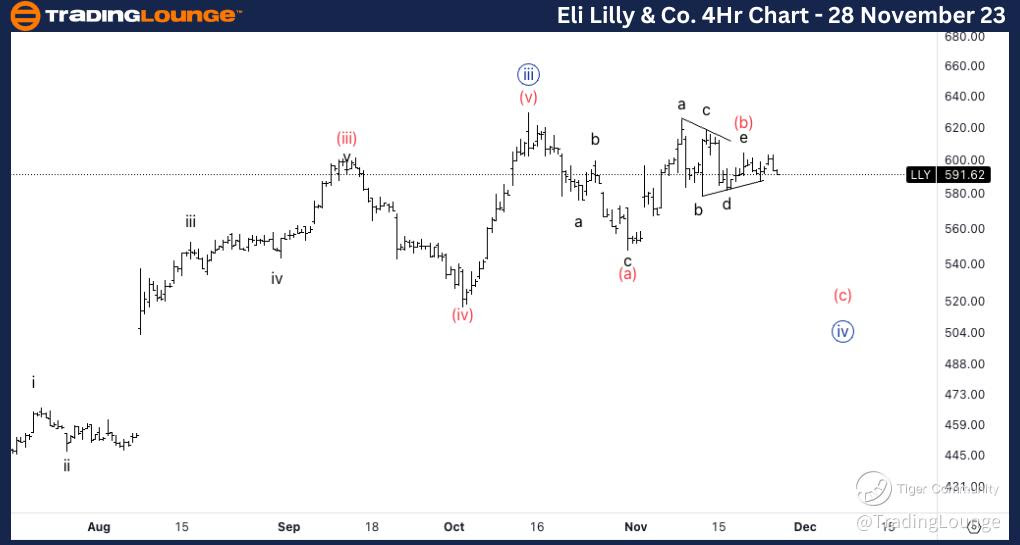
Eli Lilly & Co., (LLY:NYSE): 4h Chart 28 November 23
LLY Stock Market Analysis: Looking for triangle in wave (b) as we seem to be near the end of the correction. There is a potential head and shoulder pattern which would furthermore confer the count.
LLY Elliott Wave Count: Wave (b) of {iv}.
LLY Technical Indicators: Below 20EMA.s
LLY Trading Strategy: Looking for shorts into wave (c) on 580$ tested resistance.
TradingLounge Analyst: Alessio Barretta
Source: Tradinglounge.com get trial here!

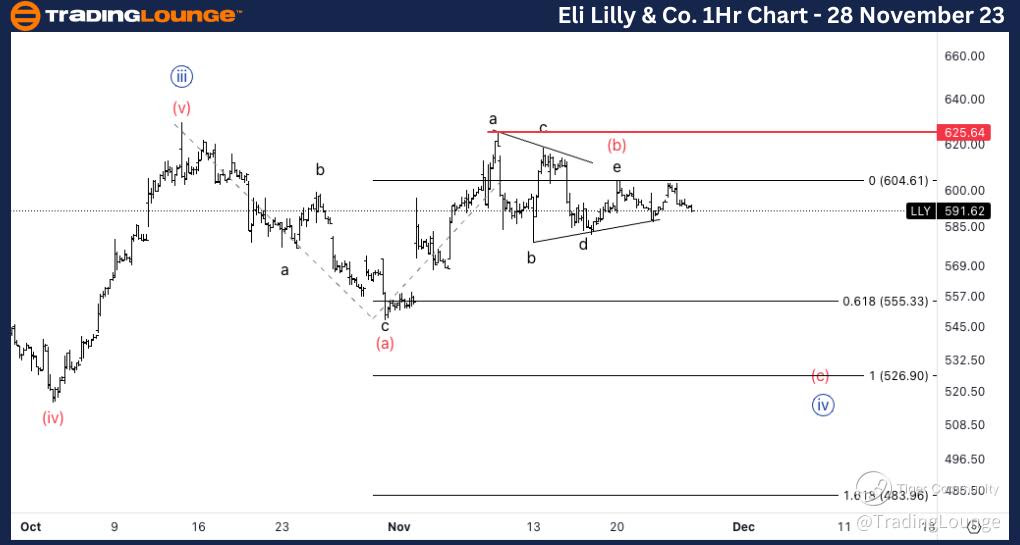
Eli Lilly & Co., LLY: 1-hour Chart 28 November 23
Eli Lilly & Co., Elliott Wave Technical Analysis
LLY Stock Market Analysis: Looking for further continuation lower, with invalidation level standing at 625$.
LLY Elliott Wave count: Wave e of (b).
LLY Technical Indicators: Between averages.
LLY Trading Strategy: Looking for shorts into wave (c) on 580$ tested resistance.
