22Aug

Indian Stock Market Update on OIL & NATURAL Gas Co. Stock Analysis: ONGC Elliott Wave Technical Analysis & Price Prediction

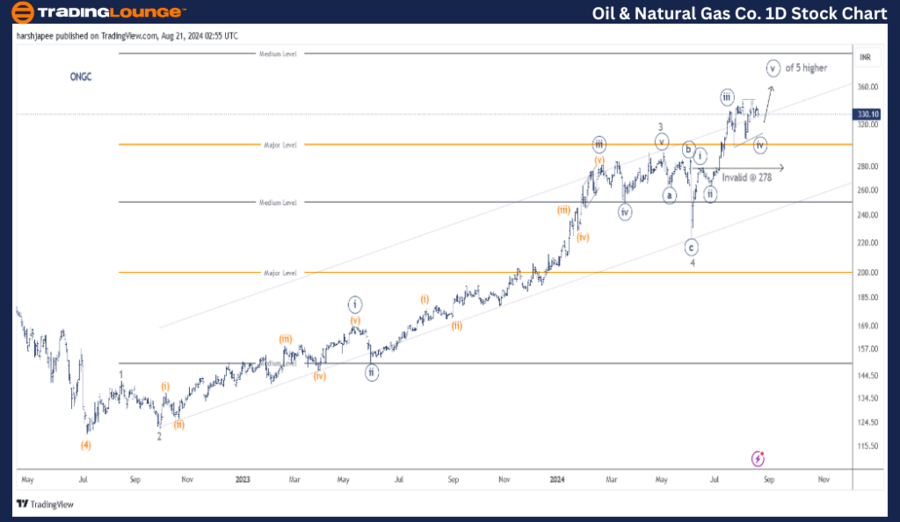
OIL & NATURAL GAS CO – ONGC Elliott Wave Analysis (1D Chart)

Function: Larger Trend Higher (Intermediate Degree Wave (5), Orange)

Mode: Motive

Structure: Impulse

Position: Minute Wave ((iv))

Details: Minute Wave ((iv)) Navy is nearing completion or may already be complete as a triangle. If accurate, Minute Wave ((v)) should soon resume its upward movement.

Invalidation Point: 278

ONGC Elliott Wave Technical Analysis

ONGC Daily Chart Technical Analysis and Potential Elliott Wave Counts

The ONGC daily chart suggests that since July 22, the Intermediate Wave (5) Orange is approaching completion as prices progress within Minute Wave ((v)) Navy, targeting the 278 mark. If this scenario holds, prices should move higher from this level or within the 310-20 range in the near term.

The stock has rallied since its July 2022 low at the 120 mark, where Intermediate Wave (4) also terminated. Minor Wave 3 extended, and Minor Wave 4 was marked complete at 222 on June 04, 2022.

Since then, Minor Wave 5 has been unfolding and is potentially concluding Minute Wave ((iv)) as a triangle around the 310-20 range. If this analysis is correct, the final thrust Wave ((v)) Navy should resume from here and extend towards the 400 mark.

OIL-&-Natural-Gas-Co...


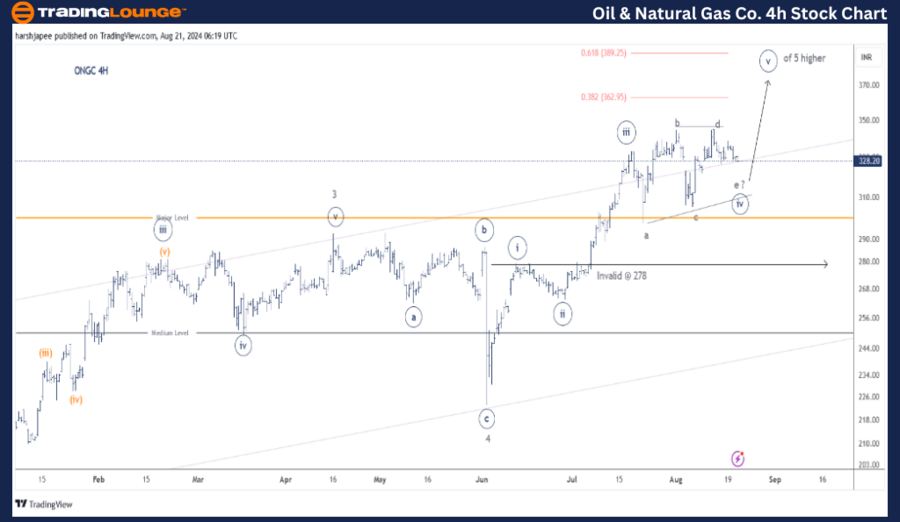
OIL & NATURAL GAS CO – ONGC Elliott Wave Technical Analysis (4H Chart)

Function: Larger Trend Higher (Intermediate Degree Wave (5), Orange)

Mode: Motive

Structure: Impulse

Position: Minute Wave ((iv))

Details: Minute Wave ((v)) Navy is expected to resume soon within Minor Wave 5 of Intermediate Wave (5) Orange.

Invalidation Point: 278

ONGC 4H Chart Technical Analysis and Potential Elliott Wave Counts

The ONGC 4H chart indicates the progressive structure of Minor Wave 5 Grey within Intermediate Wave (5) Orange, against the 222 low established since June 04. The price should ideally stay above 278, Minute Wave ((i)) Navy, to maintain the Impulse.

The stock has likely completed Minute Waves ((i)) through ((iv)) Navy and should resume its Wave ((v)) rally towards the 390-400 zone as projected here. Minute Wave ((iv)) is unfolding as a triangle, and sub-Minuette wave e appears to be near completion.

Technical Analyst: Harsh Japee

Source: visit Tradinglounge.com and learn From the Experts Join TradingLounge Here 

Previous: HCL Technologies Elliott Wave Analysis

Special Trial Offer - 0.76 Cents a Day for 3 Months! Click here

Access 7 Analysts Over 200 Markets Covered. Chat Room With Support

OIL-&-Natural-Gas-Co...


Conclusion:
ONGC is expected to resume its final thrust, Minute Wave ((v)) Navy, towards the 390-400 range, within Minor Wave 5 of Intermediate Wave (5) Orange.

Related

Our detailed U.S.Dollar /Canadian Dollar (USD/CAD) Forex Elliott Wave Technical Analysis: Market Dynamics for this Currency Pair.

Our detailed U.S.Dollar /Canadian Dollar (USD/CAD) Forex Elliott Wave Technical Analysis: Market Dynamics for this Currency Pair.

Our detailed USD/CAD Elliott Wave analysis offers valuable insights into the current market dynamics...

Read More >
Gold (XAUUSD) Elliott Wave Technical Analysis Insights for February 13, 2024

Gold (XAUUSD) Elliott Wave Technical Analysis Insights for February 13, 2024

valuable insights into Gold's market trends through Elliott Wave analysis. Discover counter-tren...

Read More >
Soybean Elliott Wave Analysis: Impulsive Trend Structure Points to Bearish Correction

Soybean Elliott Wave Analysis: Impulsive Trend Structure Points to Bearish Correction

Since the peak of tensions between Russia and Ukraine in 2022, Soybean prices have depicted a downtr...

Read More >
Dogecoin (DOGEUSD) Elliott Wave Technical Analysis: Bullish Impulse Signals Uptrend Continuation

Dogecoin (DOGEUSD) Elliott Wave Technical Analysis: Bullish Impulse Signals Uptrend Continuation

In this analysis, we explore Dogecoin's trading dynamics using Elliott Wave Theory. With a focus...

Read More >
Learn how to apply Elliott Wave theory to forecast NEO price and optimize your crypto trading strategy with NEOUSD Technical Analysis

Learn how to apply Elliott Wave theory to forecast NEO price and optimize your crypto trading strategy with NEOUSD Technical Analysis

This article offers a comprehensive Elliott Wave analysis of NEOUSD, providing insights into NEO pri...

Read More >
Euro/British Pound (EURGBP) Elliott Wave Technical Analysis Covers Market Trends and Forex Trading Strategies

Euro/British Pound (EURGBP) Elliott Wave Technical Analysis Covers Market Trends and Forex Trading Strategies

This analysis provides a comprehensive look at the EURGBP currency pair using Elliott Wave theory. T...

Read More >

Buy 1 Month

Get 3 Months!

Special Offer:

Trade Recommendations

Unleash the power of deversified trading with our comprehensive portfolio, covering:

  • Stock Trades
  • Crypto Trades
  • Forex Trades
  • Commodity Trades
Elliott Wave Analysis

Gain a competive edge with expert insights in to:

  • Global Indices
  • US Stocks & ASX Stocks
  • Forex & Crypto
  • Commodities
Top-Notch Trading Tools

Equip yourself with the tools of success:

  • Social Chat
  • Elliott Wave Algorithm
  • Screener
  • TradingLevels
  • Trading Game
7 Elliott Wave Analysts

Stay ahead of the market with daily charts and insightful videos
-Your secret to strategic trading!

JOIN HERE


Welcome to TradingLounge (ASIC A.R.No. 321187), specialists in trades, trading education and technical analysis, covering stocks, indices, commodities, forex and cryptocurrencies.

When you join TradingLounge you have access to everything we offer, including trade tools, educational content and a social platform to chat with like-minded investors.

Read more

@Copyright 2024 by tradinglounge.com

Contact Us

Australian no: 02 4787 6020

International no: +61 (2) 47876020

Pay with:

Find us on