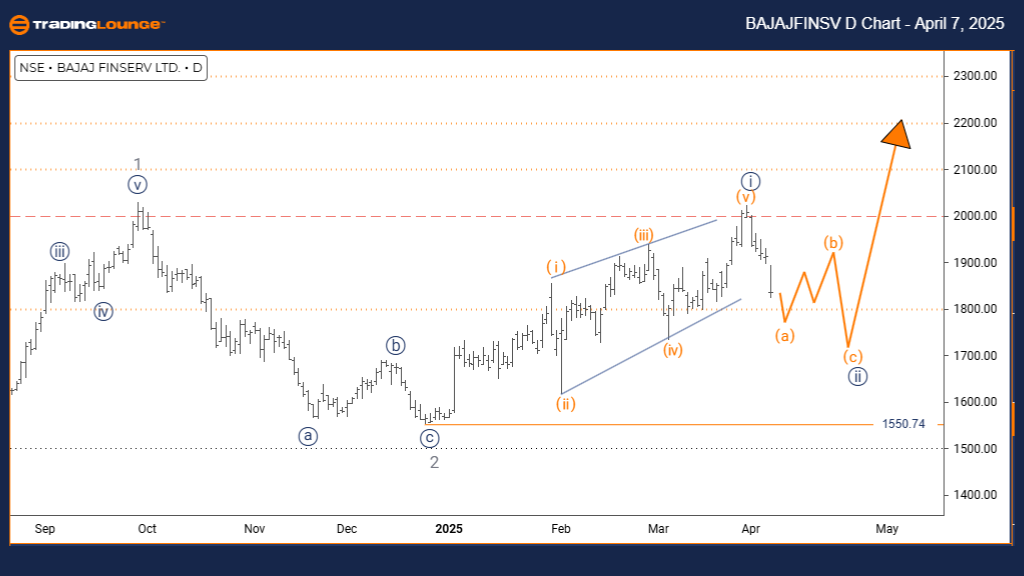
BAJAJ FINSERV Elliott Wave Analysis | Trading Lounge Daily Chart
BAJAJ FINSERV Elliott Wave Technical Analysis
Function: Counter Trend
Mode: Corrective
Structure: Navy Blue Wave 2
Position: Gray Wave 3
Next Direction Higher Degrees: Navy Blue Wave 3
Details: Navy Blue Wave 1 seems complete; Navy Blue Wave 2 is in progress
Invalidation Level: 1550.74
The daily Elliott Wave outlook for BAJAJ FINSERV reveals an ongoing counter-trend correction situated within a broader bullish market pattern. The focus currently lies on Navy Blue Wave 2, which is unfolding as part of Gray Wave 3 in the larger degree structure. The initial impulsive leg, Navy Blue Wave 1, appears to be finalized, marking the beginning of this corrective phase.
Technical traders should closely monitor the 1550.74 support level. A drop below this point would invalidate the present Elliott Wave setup. The daily chart distinctly displays the corrective structure, enabling a clearer understanding of the market's temporary pause in the uptrend.
As Navy Blue Wave 2 concludes, a shift toward Navy Blue Wave 3 is expected, signaling a return to the dominant bullish trend. This suggests a continuation of momentum in favor of long positions once the correction stabilizes.
This analysis also emphasizes the importance of wave degree interplay, identifying Navy Blue Wave 2 as both a short-term trading opportunity and a significant segment within the evolving Gray Wave 3. Traders should remain alert for corrective traits such as sideways ranges or three-wave sequences.
For optimal trade planning, it's advised to await confirmation of the correction's completion before initiating positions. This setup offers attractive short-term pullback trades, as well as potential entry points for long-term trend followers.
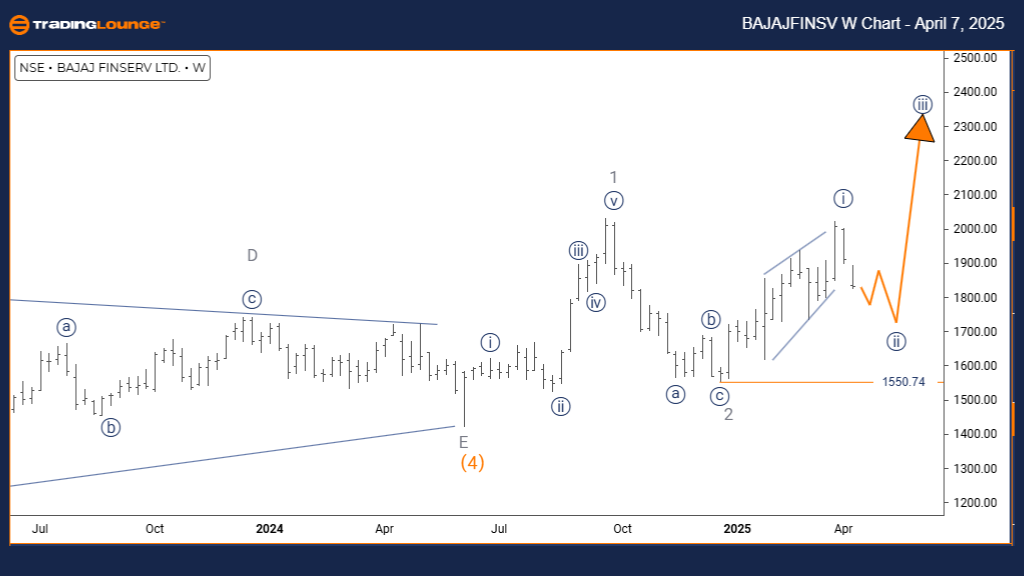
BAJAJ FINSERV Elliott Wave Analysis | Trading Lounge Weekly Chart
BAJAJ FINSERV Elliott Wave Technical Analysis
Function: Counter Trend
Mode: Corrective
Structure: Navy Blue Wave 2
Position: Gray Wave 3
Next Direction Higher Degrees: Navy Blue Wave 3
Details: Navy Blue Wave 1 seems to have completed; Navy Blue Wave 2 is unfolding
Invalidation Level: 1550.74
The weekly Elliott Wave forecast for BAJAJ FINSERV outlines a medium-term counter-trend phase developing inside a broader bullish wave structure. Currently, Navy Blue Wave 2 is forming a correction within the larger Gray Wave 3, following the likely completion of Navy Blue Wave 1.
This weekly time-frame analysis aids both swing traders and long-term investors in positioning themselves based on macro-structural signals. The critical level to observe is 1550.74, which serves as the invalidation point for the ongoing wave structure. Any decisive move below it would require a reevaluation of the Elliott Wave count.
Wave relationship dynamics play a crucial role in this setup, with Navy Blue Wave 2 representing both a corrective leg and a strategic setup within the bullish continuation of Gray Wave 3. Traders should remain watchful for classic correction indicators like sideways action or A-B-C formations.
The analysis encourages waiting for a confirmed end to the corrective move before committing to major trades. The weekly chart provides vital clarity for position sizing and strategy planning across both short-term pullback entries and long-term investment opportunities.
Technical Analyst: Malik Awais
Source: visit Tradinglounge.com and learn From the Experts Join TradingLounge Here
Previous: INFOSYS Elliott Wave Technical Analysis
VALUE Offer - Buy 1 Month & Get 3 Months!Click here
Access 7 Analysts Over 200 Markets Covered. Chat Room With Support