GX Uranium ETF (URA) Elliott Wave Analysis
Function - Counter trend
Mode - Corrective
Structure - Zigzag for 4. Impulse for (A)
Position - Wave 4 of (A)
Direction - Wave 5 of (A)
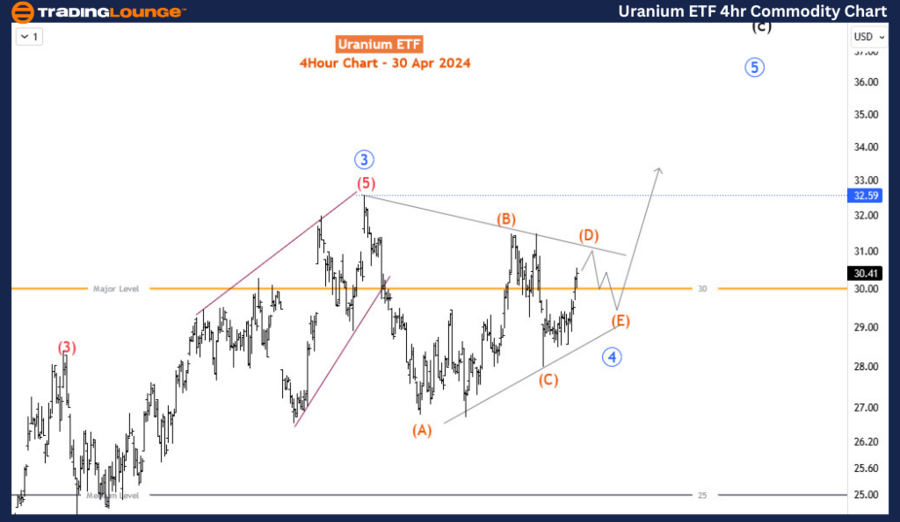
Details - Price continues to circle the 30 major levels. We can now consider the blue wave ‘4’ of the primary degree to be a triangle Elliott wave pattern. Primary wave ’5’ (blue) is favoured to break above 32.5.
The GX Uranium ETF, a specialized exchange-traded fund (ETF), has been meticulously designed to capitalize on opportunities within the uranium industry. Uranium, a fundamental element in the production of nuclear energy, serves as the cornerstone of this ETF's investment strategy. By focusing on companies deeply entrenched in the uranium sector, ranging from miners to producers and exploration firms, the GX Uranium ETF aims to offer investors a conduit to the burgeoning potential of this industry.
Over the past three months, spanning from February to April of 2024, the GX URA ETF has demonstrated a lateral movement in its price action. However, preceding this phase, the ETF embarked on a robust upward trajectory commencing from March 2023, and extending until the onset of February 2024. Remarkably, during this period, the ETF surged by an impressive 77%, only to encounter a sharp downturn, followed by a consolidation phase near the pivotal 30 major level.
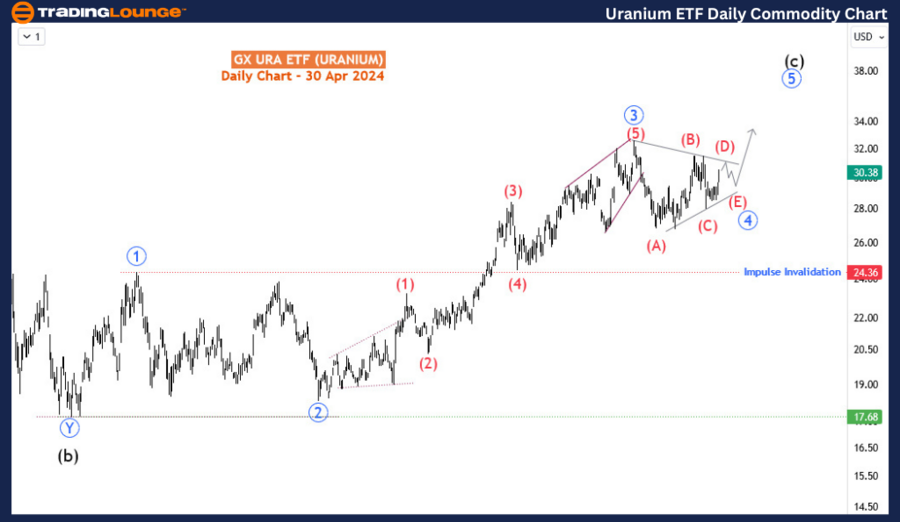
Uranium ETF Daily Chart Analysis
A discerning analysis of the daily chart unveils a compelling narrative of bullish momentum characterized by an impulse wave originating from July 2022. This bullish wave culminated in the completion of the third leg, denoted as the primary degree wave 3 (circled blue). Presently, the ETF finds itself ensconced within a lateral movement since the 1st of April, which corresponds to the emergence of the fourth wave, identified as the primary degree wave 4 (circled blue). This consolidation phase, while seemingly stagnant, portends an imminent breakout, heralding the resumption of the bullish trend and the charting of fresh highs for the year 2024.
GX Uranium ETF (URA) Commodity H4 Chart Perspective
Zooming in on the H4 chart, the primary degree wave 4 appears to be nearing the culmination of a triangle pattern. Notably, the low of wave (C) serves as the critical level of invalidation, situated at 28.01. Unless the price breaches this crucial threshold, the prevailing bullish sentiment retains its potency, poised to propel the ETF towards its next peak after the completion and subsequent breakout of the triangle pattern, potentially targeting the 32.59 high.
Conclusion
In conclusion, the GX Uranium ETF is poised at a critical juncture, with its price movements tightly coiled in a corrective triangle pattern. Investors and traders should monitor these levels closely, as the culmination of Wave 4 could herald the beginning of Wave 5, characterized by a robust ascent to new peaks. The Elliott Wave analysis provides a structured approach to understanding potential future price actions based on the ETF’s recent behaviour and wave patterns.
Technical Analyst: Sanmi Adeagbo
Source: visit Tradinglounge.com and learn From the Experts Join TradingLounge Here
See Previous: Soybeans Commodity Elliott Wave Technical Analysis
Special Trial Offer - 0.76 Cents a Day for 3 Months! Click here
Access 6 Analysts covering over 150 Markets. Chat Room With Support