23Jan

MicroStrategy Inc. (MSTR) Stocks Elliott Wave Technical Analysis: Covers Potential Trends, Trading Strategies, and Key Resistance Levels

MSTR Elliott Wave Analysis | MicroStrategy Inc. (MSTR) Stock Forecast

This analysis examines the current price action of MicroStrategy Inc. (MSTR) using Elliott Wave Theory across both the daily and 1-hour charts. Below is a detailed outlook on the stock's positioning and potential price movements.

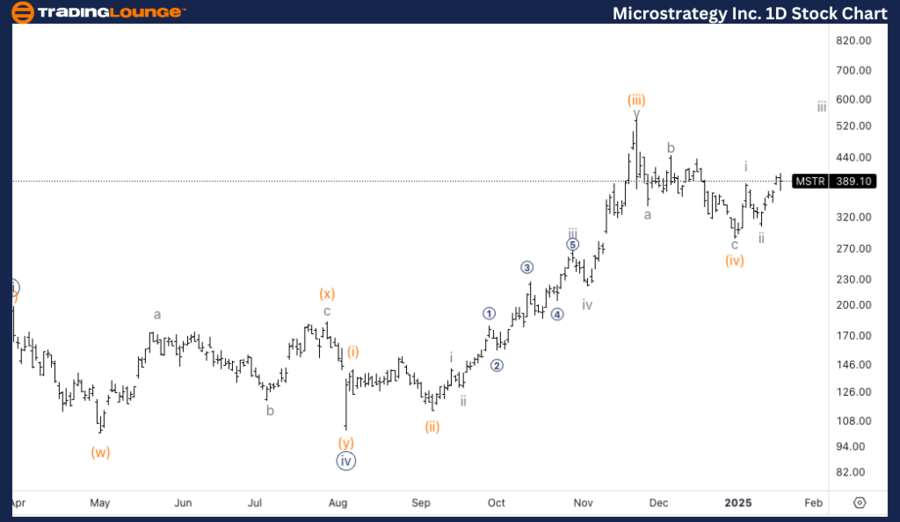
MSTR Elliott Wave Analysis | Trading Lounge Daily Chart

MicroStrategy Inc. (MSTR) Daily Chart Analysis

MSTR Elliott Wave Technical Analysis

  • Function: Trend
  • Mode: Impulsive
  • Structure: Motive
  • Position: Wave (v) of {v}
  • Direction: Uptrend in wave (v)
  • Details: Upside momentum is expected as the stock advances into wave iii of (v), approaching the key Trading Level 5 at $500.

MSTR Elliott Wave Technical Analysis – Daily Chart Breakdown

MicroStrategy (MSTR) continues to exhibit strong bullish momentum, advancing within wave iii of (v). Upside price targets are set near the critical Trading Level 5 at $500, which serves as an important psychological and technical resistance level. The current impulsive Elliott Wave pattern suggests the potential for further gains, reinforcing a positive outlook for investors.

Key Takeaways:

  • Watch for potential resistance around $500, a significant trading level.
  • Sustained bullish movement could pave the way for higher targets beyond $500.
  • Strong trading volume and price action confirmations are essential for further rally validation.

MicroStrategy-Inc-1D...


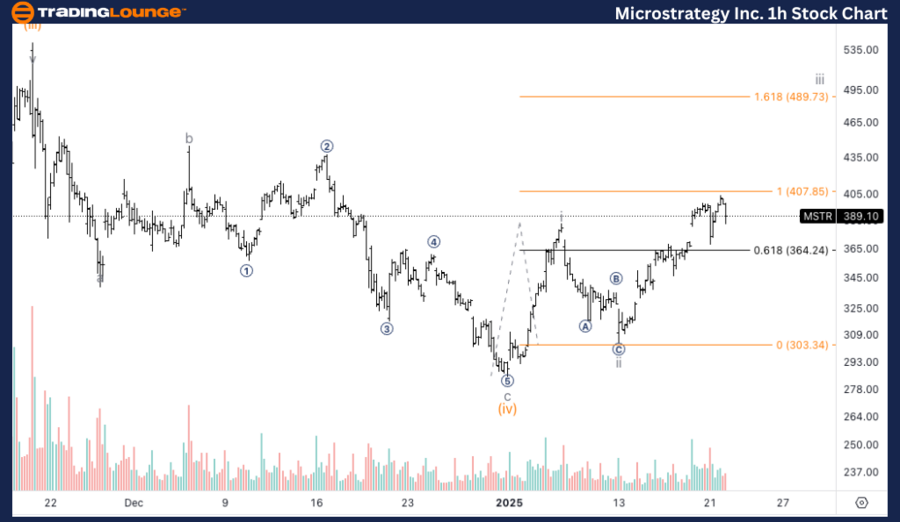
MicroStrategy Inc. (MSTR) 1-Hour Chart Analysis

MSTR Elliott Wave Technical Analysis

  • Function: Trend
  • Mode: Impulsive
  • Structure: Motive
  • Position: Wave iii of (v)
  • Direction: Uptrend in wave iii
  • Details: Further upside potential as wave iii nears equality with wave i, a possible resistance point that could trigger a corrective pullback.

MSTR Elliott Wave Technical Analysis – 1H Chart Breakdown

MicroStrategy (MSTR) is expected to maintain its upward trajectory, progressing within wave iii of (v). The next critical resistance level aligns with the equality of wave iii vs. wave i, which could act as a hurdle for further growth. A failure to break this level could result in a double correction, leading to temporary consolidation before resuming the uptrend.

Key Takeaways:

  • Monitor resistance at wave iii vs. wave i equality for potential price reactions.
  • Failure to break through resistance may trigger a corrective pullback, offering buying opportunities.
  • Investors should observe volume trends to confirm the stock’s strength in continuation patterns.

Technical Analyst: Alessio Barretta

Source: visit Tradinglounge.com and learn From the Experts Join TradingLounge Here 

See Previous: Netflix Inc. (NFLX) Elliott Wave Technical Analysis

VALUE Offer - Buy 1 Month & Get 3 Months!Click here

Access 7 Analysts Over 200 Markets Covered. Chat Room With Support

MicroStrategy-Inc-1h...


Conclusion

The Elliott Wave Analysis of MicroStrategy (MSTR) indicates a prevailing bullish trend across both daily and intraday charts. As the stock approaches critical resistance levels, traders should remain vigilant for potential breakouts or corrective moves. The key focus remains on the $500 level in the daily chart and the wave equality resistance in the 1-hour chart.

SEO Keywords:
MicroStrategy stock forecast, MSTR Elliott Wave analysis, MSTR stock price prediction, MicroStrategy technical analysis, Elliott Wave trading strategy, stock market trends, MSTR price target.

Related

Elliott Wave XLE SPDR Energy Select Sector ETF Analysis Reveals Bullish Energy ETF Forecast and Key Trading Strategy for 2025 Investors

Elliott Wave XLE SPDR Energy Select Sector ETF Analysis Reveals Bullish Energy ETF Forecast and Key Trading Strategy for 2025 Investors

This technical overview of XLE applies Elliott Wave analysis to project upcoming movements in the SP...

Read More >
Berkshire Hathaway (BRK.B) Elliott Wave Analysis, Stock Forecast, Price Prediction, Trend Outlook & Trading Strategy

Berkshire Hathaway (BRK.B) Elliott Wave Analysis, Stock Forecast, Price Prediction, Trend Outlook & Trading Strategy

Berkshire Hathaway (BRK.B) remains in an impulsive uptrend, currently advancing in wave {iii} of 5. ...

Read More >
ADANI GREEN Elliott Wave Analysis, Stock Forecast, Price Prediction, Technical Analysis, Market Trends & Trading Strategy

ADANI GREEN Elliott Wave Analysis, Stock Forecast, Price Prediction, Technical Analysis, Market Trends & Trading Strategy

ADANI GREEN Elliott Wave analysis covering daily and weekly stock trends. This report provides techn...

Read More >
Elliott Wave Analysis Highlights: Navigating Commodity Market Trends with Confidence

Elliott Wave Analysis Highlights: Navigating Commodity Market Trends with Confidence

This summary highlights the key points from an Elliott Wave analysis update on commodity markets. Th...

Read More >
"Elliott Wave Analysis: NASDAQ 100, SP500, and Top Tech Stocks - Trading Strategies and Market Forecast"

"Elliott Wave Analysis: NASDAQ 100, SP500, and Top Tech Stocks - Trading Strategies and Market Forecast"

This analysis covers the Elliott Wave patterns for NASDAQ 100, SP500, and major tech stocks like App...

Read More >
S&P 500 Elliott Wave Technical Analysis: Forecasts, Trading Strategies, and Market Trends for Successful Stock Trading

S&P 500 Elliott Wave Technical Analysis: Forecasts, Trading Strategies, and Market Trends for Successful Stock Trading

S&P 500 Elliott Wave Analysis including day and weekly charts. Understand wave patterns like impulse...

Read More >
Elliott Wave XLE SPDR Energy Select Sector ETF Analysis Reveals Bullish Energy ETF Forecast and Key Trading Strategy for 2025 Investors

Elliott Wave XLE SPDR Energy Select Sector ETF Analysis Reveals Bullish Energy ETF Forecast and Key Trading Strategy for 2025 Investors

This technical overview of XLE applies Elliott Wave analysis to project upcoming movements in the SP...

Read More >
Berkshire Hathaway (BRK.B) Elliott Wave Analysis, Stock Forecast, Price Prediction, Trend Outlook & Trading Strategy

Berkshire Hathaway (BRK.B) Elliott Wave Analysis, Stock Forecast, Price Prediction, Trend Outlook & Trading Strategy

Berkshire Hathaway (BRK.B) remains in an impulsive uptrend, currently advancing in wave {iii} of 5. ...

Read More >
ADANI GREEN Elliott Wave Analysis, Stock Forecast, Price Prediction, Technical Analysis, Market Trends & Trading Strategy

ADANI GREEN Elliott Wave Analysis, Stock Forecast, Price Prediction, Technical Analysis, Market Trends & Trading Strategy

ADANI GREEN Elliott Wave analysis covering daily and weekly stock trends. This report provides techn...

Read More >
Elliott Wave Analysis Highlights: Navigating Commodity Market Trends with Confidence

Elliott Wave Analysis Highlights: Navigating Commodity Market Trends with Confidence

This summary highlights the key points from an Elliott Wave analysis update on commodity markets. Th...

Read More >
"Elliott Wave Analysis: NASDAQ 100, SP500, and Top Tech Stocks - Trading Strategies and Market Forecast"

"Elliott Wave Analysis: NASDAQ 100, SP500, and Top Tech Stocks - Trading Strategies and Market Forecast"

This analysis covers the Elliott Wave patterns for NASDAQ 100, SP500, and major tech stocks like App...

Read More >
S&P 500 Elliott Wave Technical Analysis: Forecasts, Trading Strategies, and Market Trends for Successful Stock Trading

S&P 500 Elliott Wave Technical Analysis: Forecasts, Trading Strategies, and Market Trends for Successful Stock Trading

S&P 500 Elliott Wave Analysis including day and weekly charts. Understand wave patterns like impulse...

Read More >

Buy 1 Month

Get 3 Months!

Special Offer:

Trade Recommendations

Unleash the power of deversified trading with our comprehensive portfolio, covering:

  • Stock Trades
  • Crypto Trades
  • Forex Trades
  • Commodity Trades
Elliott Wave Analysis

Gain a competive edge with expert insights in to:

  • Global Indices
  • US Stocks & ASX Stocks
  • Forex & Crypto
  • Commodities
Top-Notch Trading Tools

Equip yourself with the tools of success:

  • Social Chat
  • Elliott Wave Algorithm
  • Screener
  • TradingLevels
  • Trading Game
7 Elliott Wave Analysts

Stay ahead of the market with daily charts and insightful videos
-Your secret to strategic trading!

JOIN HERE


Welcome to TradingLounge (ASIC A.R.No. 321187), specialists in trades, trading education and technical analysis, covering stocks, indices, commodities, forex and cryptocurrencies.

When you join TradingLounge you have access to everything we offer, including trade tools, educational content and a social platform to chat with like-minded investors.

Read more

@Copyright 2024 by tradinglounge.com

Contact Us

Australian no: 02 4787 6020

International no: +61 (2) 47876020

Pay with:

Find us on