In-Depth PANW Elliott Wave Analysis – Palo Alto Networks Inc. (PANW)

In this Elliott Wave Analysis of Palo Alto Networks Inc. (PANW), the focus is on identifying potential trading opportunities by analyzing PANW's price movements through the Elliott Wave framework. This analysis is broken down into the daily and 1-hour charts, providing a clearer outlook on the stock's short-term and long-term trends.

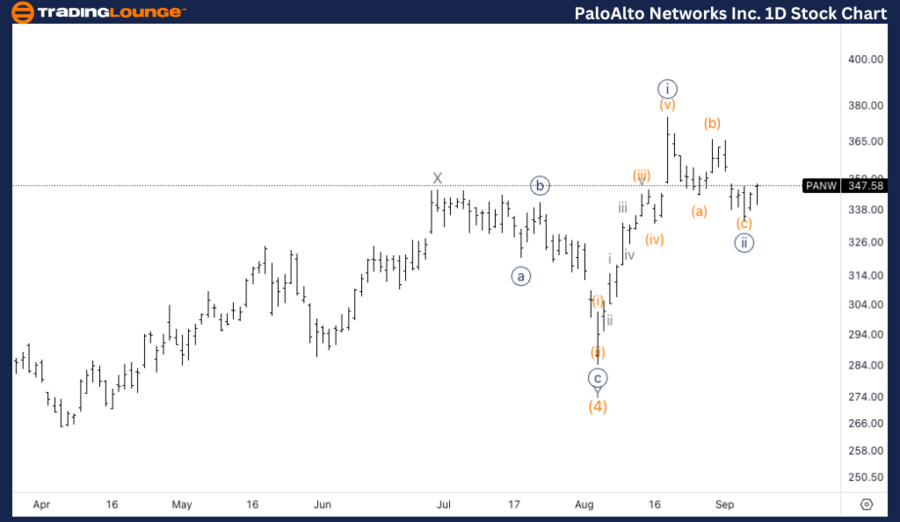
PANW Elliott Wave Analysis – Trading Lounge Daily Chart

Palo Alto Networks Inc. (PANW) Daily Chart

PANW Elliott Wave Technical Analysis

Function: Trend

Mode: Impulsive

Structure: Motive

Position: Minor wave 1 of (5)

Direction: Upside into wave 1

Details: The daily chart analysis shows a potential resumption of the uptrend after a three-wave correction in wave (4). The price is currently positioned between TL3 and $400, signaling an upward movement as wave 1 progresses.

PANW Elliott Wave Technical Analysis – Daily Chart

The daily chart shows Palo Alto Networks (PANW) is currently in an impulsive uptrend. The stock is progressing within Minor wave 1 of Intermediate wave (5). After completing a corrective three-wave pattern in wave (4), PANW looks set to resume its uptrend, heading towards higher price levels. Traders should monitor the movement between TL3 and $400 for further validation.

PaloAlto-Networks-In...


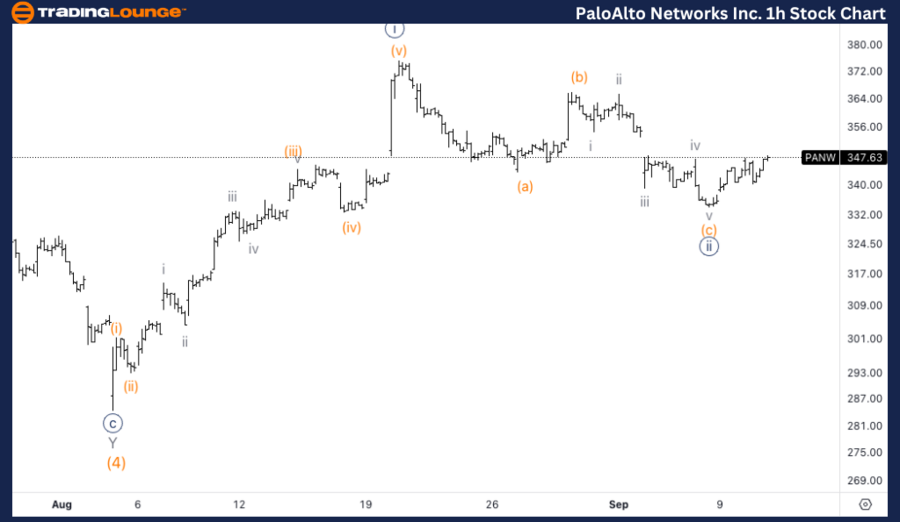
PANW Elliott Wave Analysis – Trading Lounge 1H Chart

Palo Alto Networks Inc. (PANW) 1H Chart

PANW Elliott Wave Technical Analysis

Function: Trend

Mode: Impulsive

Structure: Motive

Position: Wave {iii} of 1

Direction: Bottom in wave {ii}

Details: The 1-hour chart suggests that PANW may have already completed wave 2 instead of wave {ii}, marking the end of a corrective phase. The stock is now likely moving into wave {iii}, supported by a clear three-wave correction in wave {ii}.

PANW Elliott Wave Technical Analysis – 1H Chart

The 1-hour chart analysis highlights that PANW is advancing within wave {iii} of 1, a strong impulsive phase. The stock appears to have bottomed in wave {ii}, indicating the end of the correction. The clear three-wave pattern into wave {ii} supports the expectation that wave {iii} is now unfolding, offering potential upside opportunities.

Technical Analyst: Alessio Barretta

Source: visit Tradinglounge.com and learn From the Experts Join TradingLounge Here 

See Previous: Netflix Inc. NFLX Elliott Wave Technical Analysis 

Special Trial Offer - 0.76 Cents a Day for 3 Months! Click here

Access 7 Analysts Over 200 Markets Covered. Chat Room With Support

PaloAlto-Networks-In...

Related

Shanghai Composite Index Elliott Wave Forecast: Bullish Wave 3 Trend Explained with Daily and Weekly Chart Analysis

Shanghai Composite Index Elliott Wave Forecast: Bullish Wave 3 Trend Explained with Daily and Weekly Chart Analysis

Analyze Shanghai Composite Index using Elliott Wave theory. Learn about the bullish Wave 3 impulse a...

Read More >
S&P/TSX 60 Index Elliott Wave Analysis: Market Trends, Forecast, Market Movements with this Comprehensive Technical Analysis

S&P/TSX 60 Index Elliott Wave Analysis: Market Trends, Forecast, Market Movements with this Comprehensive Technical Analysis

This analysis provides a detailed Elliott Wave forecast for the S&P/TSX 60 index, covering the lates...

Read More >
British Pound/ Australian Dollar(GBPAUD) Trading - Forex Analysis & Elliott Wave Technical Forecast

British Pound/ Australian Dollar(GBPAUD) Trading - Forex Analysis & Elliott Wave Technical Forecast

This detailed article provides an in-depth GBPAUD Elliott Wave Analysis, offering traders critical i...

Read More >
USDJPY Elliott Wave Technical Analysis: U.S. Dollar / Japanese Yen Forex Pair Bearish Trend & Forecast for Traders

USDJPY Elliott Wave Technical Analysis: U.S. Dollar / Japanese Yen Forex Pair Bearish Trend & Forecast for Traders

This USDJPY Elliott Wave Analysis provides an in-depth look at the bearish trend, price action, and ...

Read More >
Adani Green Energy Stocks Elliott Wave Technical Analysis: Understand Potential Bullish and Bearish Scenarios

Adani Green Energy Stocks Elliott Wave Technical Analysis: Understand Potential Bullish and Bearish Scenarios

This article provides a detailed Elliott Wave analysis of ADANI GREEN ENERGY, including its current ...

Read More >
EURUSD Elliott Wave Analysis: Bullish Trend Insights, Technical Forecasts, and Market Strategies for Forex Traders

EURUSD Elliott Wave Analysis: Bullish Trend Insights, Technical Forecasts, and Market Strategies for Forex Traders

EUR/USD Elliott Wave analysis, focusing on a bullish trend identified on the daily and 4-hour charts...

Read More >

$1 for 2 Weeks

then $29 a month!

What a Special Offer!

Trade Recommendations

Unleash the power of deversified trading with our comprehensive portfolio, covering 250+ markets:

  • Stock Trades
  • Crypto Trades
  • Forex Trades
  • Commodity Trades
Elliott Wave Analysis

Gain a competitive edge with expert insights and AI-powered Elliott Wave charting into:

  • Global Indices
  • US Stocks & ASX Stocks
  • Forex & Crypto
  • Commodities
Top-Notch Trading Tools

Equip yourself with the tools of success:

  • Real-time Chat rooms
  • Elliott Wave Algorithm
  • Portfolio tools
  • TradingLevels
  • Screener
  • Trading Game
7 Elliott Wave Analysts

Stay ahead of the market with daily charts and insightful videos
Your secret to strategic trading!

JOIN HERE


Welcome to TradingLounge (ASIC A.R.No. 321187), specialists in trades, trading education and technical analysis, covering stocks, indices, commodities, forex and cryptocurrencies.

When you join TradingLounge you have access to everything we offer, including trade tools, educational content and a social platform to chat with like-minded investors.

Read more

@Copyright 2024 by tradinglounge.com

Contact Us

Australian no: 02 4787 6020

International no: +61 (2) 47876020

Pay with:

Find us on