EURUSD Elliott Wave Analysis – Trading Lounge Daily Chart
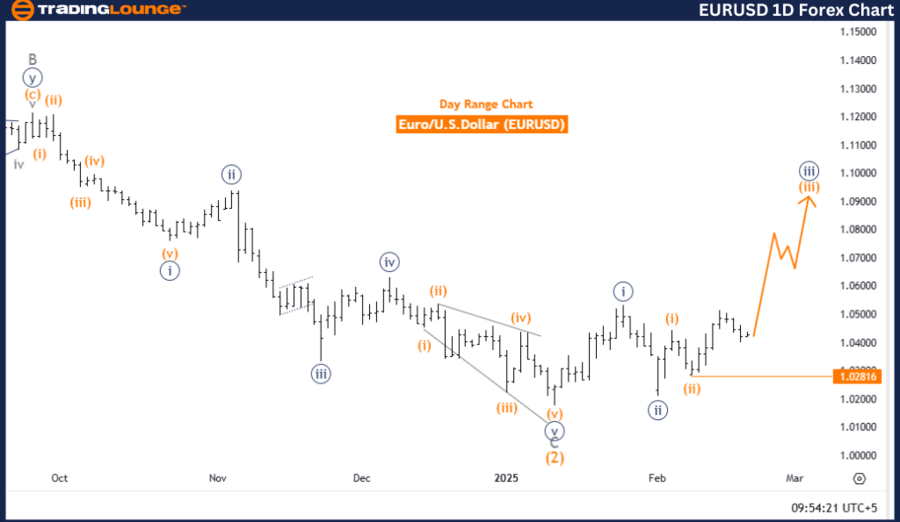
Euro/ U.S. Dollar (EURUSD) Daily Chart Analysis
EURUSD Elliott Wave Technical Analysis
The EURUSD Elliott Wave analysis for the daily chart highlights a bullish trend for the Euro against the US Dollar, based on Elliott Wave Theory, which identifies repetitive wave structures in price action.
The market is currently in an impulsive phase, signifying a strong directional movement. The wave structure is identified as Orange Wave 3, which plays a crucial role in the broader bullish trend.
The completion of Orange Wave 2 and the initiation of Orange Wave 3 confirm the uptrend, as Wave 3 is typically the most extended and powerful in an Elliott Wave sequence. This further strengthens the bullish outlook for EURUSD.
A critical level to watch is the wave invalidation level at 1.02816. If the price falls below this threshold, the current wave count will be invalidated, potentially shifting the trend direction. Traders must keep a close watch on this level to confirm the continuation of the bullish structure.
Conclusion
The EURUSD daily chart analysis reinforces the ongoing bullish trend, with Orange Wave 3 currently active. The successful completion of Orange Wave 2 and the impulsive nature of Wave 3 suggest strong upward momentum.
The wave invalidation level at 1.02816 is a key price threshold to monitor. A break below this level could disrupt the bullish wave count. Traders should incorporate this Elliott Wave analysis into their trading strategies, as the market appears poised for continued upward movement in the near term.
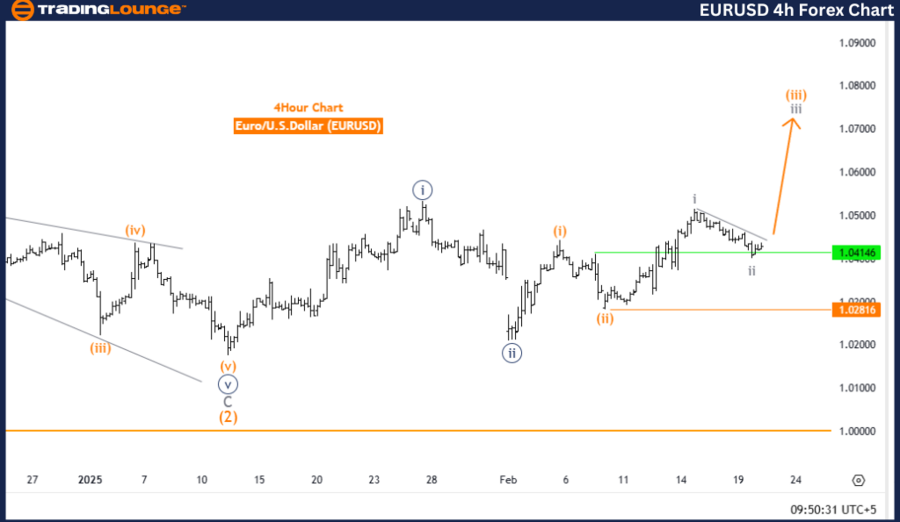
Euro/ U.S. Dollar (EURUSD) 4-Hour Chart Analysis
EURUSD Elliott Wave Technical Analysis
The EURUSD Elliott Wave analysis for the 4-hour chart confirms a bullish market trend. This analysis follows Elliott Wave Theory, which identifies repetitive price patterns and market cycles.
The impulsive market mode signals a strong directional movement. The wave structure is identified as Gray Wave 3, which is part of a broader Orange Wave 3, reinforcing the bullish outlook.
The completion of Gray Wave 2 within Orange Wave 3 and the activation of Gray Wave 3 suggest that the market is continuing its upward trajectory. As Wave 3 is often the most powerful and extended in an Elliott Wave sequence, this further confirms the bullish momentum.
A critical level to monitor is the wave invalidation level at 1.02816. If the price breaks below this threshold, the current wave structure will be invalidated, potentially shifting the market trend. Traders must closely watch this level for confirmation of the bullish continuation.
Conclusion
The EURUSD 4-hour chart analysis supports the continuation of the bullish trend, with Gray Wave 3 currently active. The completion of Gray Wave 2 and the initiation of Gray Wave 3 signal strong upward momentum in the market.
The wave invalidation level at 1.02816 remains a crucial price point. A break below this level could disrupt the bullish Elliott Wave structure. Traders should remain cautious and incorporate this analysis into their trading strategies. Given the impulsive nature of the current wave pattern, the market is likely to sustain its bullish movement in the near term.
Technical Analyst: Malik Awais
Source: visit Tradinglounge.com and learn From the Experts Join TradingLounge Here
Previous: USDJPY Elliott Wave Technical Analysis
VALUE Offer - Buy 1 Month & Get 3 Months!Click here
Access 7 Analysts Over 200 Markets Covered. Chat Room With Support