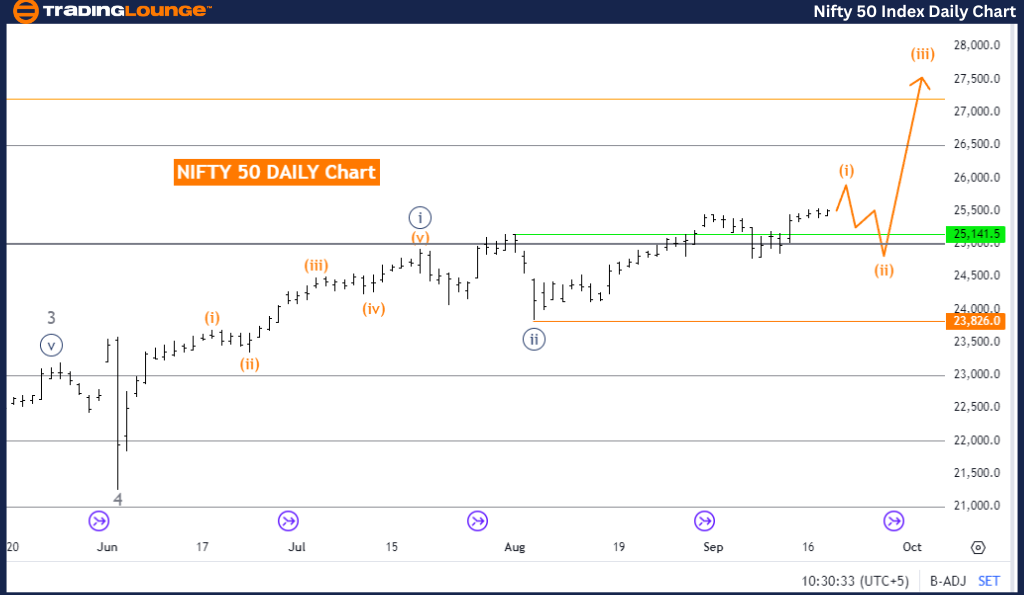
NIFTY 50 (INDIA) Elliott Wave Analysis - Daily Chart
NIFTY 50 (INDIA) Elliott Wave Technical Analysis
Function: Trend
Mode: Impulsive
Structure: Orange Wave 1
Position: Navy Blue Wave 3
Direction Next Lower Degrees: Orange Wave 2
Details: Navy Blue Wave 2 has completed, and Orange Wave 1 of Navy Blue Wave 3 is unfolding.
Wave Cancel Invalidation Level: 23,826.0
The NIFTY 50 Elliott Wave analysis on the daily chart reveals that the market is in a trending phase, following an impulsive structure. The current formation is Orange Wave 1, which suggests that the market is in the initial stages of a larger upward movement within the Elliott Wave framework.
Presently, the market is positioned within Navy Blue Wave 3, which began after the completion of Navy Blue Wave 2. Wave 3, as per Elliott Wave theory, typically exhibits strong upward momentum, aligning with the impulsive nature of the trend. This transition from Wave 2 to Wave 3 signifies the beginning of a stronger upward cycle.
Key Observations:
- Navy Blue Wave 2 has completed.
- Orange Wave 1 of Navy Blue Wave 3 is progressing, indicating the early phase of a significant upward move.
- The impulsive structure points to further upward movement, with Orange Wave 2 expected after Orange Wave 1 concludes.
Wave Invalidation Level:
The invalidation level for this scenario is set at 23,826.0. If the price drops below this level, the current wave pattern would be invalidated, requiring a reassessment of the market structure. As long as the price stays above this level, the upward trend is expected to continue, with Orange Wave 1 driving the movement within Navy Blue Wave 3.
Summary:
On the daily chart, NIFTY 50 is in an impulsive phase, with Orange Wave 1 of Navy Blue Wave 3 actively progressing. The bullish trend is expected to persist as long as the price does not fall below the invalidation level of 23,826.0.
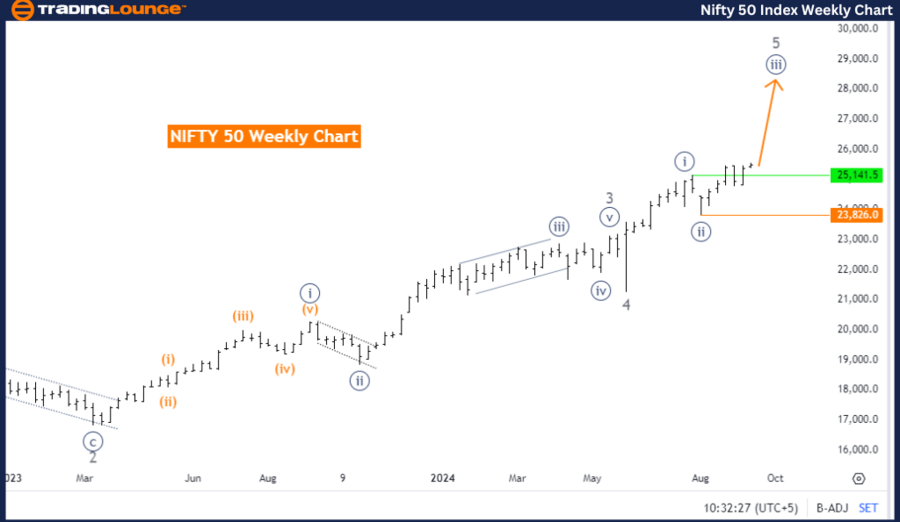
NIFTY 50 (INDIA) Elliott Wave Analysis - Weekly Chart
NIFTY 50 (INDIA) Elliott Wave Technical Analysis
Function: Trend
Mode: Impulsive
Structure: Navy Blue Wave 3
Position: Gray Wave 5
Direction Next Higher Degrees: Navy Blue Wave 3 (continuing)
Details: Navy Blue Wave 2 of 5 has completed, with Navy Blue Wave 3 now developing.
Wave Cancel Invalidation Level: 23,826.0
The NIFTY 50 Elliott Wave analysis on the weekly chart highlights a strong impulsive upward trend. The structure being analyzed is Navy Blue Wave 3, part of the larger Gray Wave 5 formation. This suggests that the market is in the middle of a significant upward cycle, with more upward potential as Wave 3 progresses.
The market is currently in Navy Blue Wave 3, following the conclusion of Navy Blue Wave 2 of 5. This indicates that the corrective phase linked to Wave 2 has ended, and the market has entered the impulsive stage of Wave 3. Historically, Wave 3 represents a strong and extended move, aligning with the current upward trend.
Key Insights:
- Navy Blue Wave 3 is expected to push the market further upward, continuing the impulsive phase.
- The market's trend appears to be strengthening as it progresses through Navy Blue Wave 3.
Wave Invalidation Level:
The invalidation level for this wave count is 23,826.0. If the price drops below this level, the current Elliott Wave scenario would be invalid, requiring a re-evaluation. However, if the price remains above this level, the ongoing upward trend, driven by Navy Blue Wave 3, is expected to continue.
Summary:
On the weekly chart, NIFTY 50 is experiencing an impulsive upward trend, with Navy Blue Wave 3 forming within the larger Gray Wave 5 structure. The completion of Navy Blue Wave 2 signals the beginning of a stronger upward movement in Wave 3, provided the price remains above the invalidation level of 23,826.0.
Technical Analyst: Malik Awais
Source: visit Tradinglounge.com and learn From the Experts Join TradingLounge Here
Previous: NIKKEI 225 Index Elliott Wave Analysis
Special Trial Offer - 0.76 Cents a Day for 3 Months! Click here
Access 7 Analysts Over 200 Markets Covered. Chat Room With Support