Elliott Wave Analysis TradingLounge Daily Chart
In the realm of cryptocurrency trading, Elliott Wave Analysis stands out as a powerful tool for discerning market trends and making informed trading decisions. Let's delve into a detailed Elliott Wave Analysis of Bitcoin against the US dollar (BTCUSD) to uncover valuable insights and actionable strategies for traders.
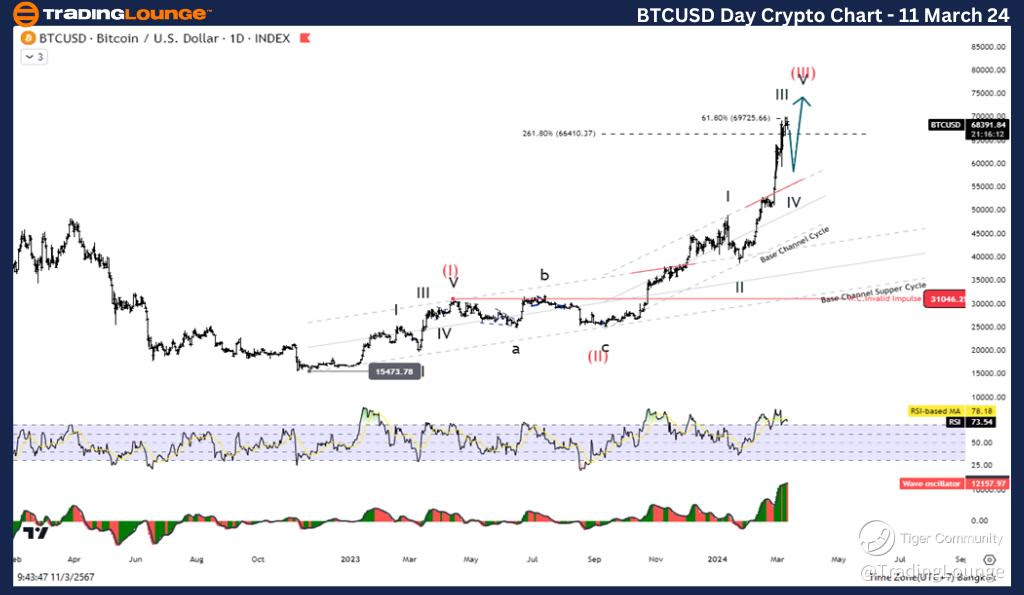
Bitcoin/ U.S. dollar(BTCUSD) Daily Chart Analysis
BTCUSD Elliott Wave Technical Analysis
Elliott Wave Analysis: BTCUSD Daily Chart
Function: Follow Trend
Mode: Motive
Structure: Impulse
Position: Wave III
Direction Next higher Degrees: Wave (III)
Wave Cancel invalid level: 31046.25
BTCUSD Technical Analysis Overview: The BTCUSD pair exhibits a strong bullish momentum, characterized by a five-wave increase in Wave (III). However, traders should remain vigilant for potential corrective movements in the near term.
BTCUSD Trading Strategy: Bitcoin's upward trajectory persists, primarily driven by the third wave's ascent. Anticipate a breakthrough of the all-time high at 68997.75. Nonetheless, exercise caution as the rally approaches its zenith. Expect two more waves to complete the significant Impulse structure, while remaining attentive to corrective actions.
BTCUSD Technical Indicators: Price action remains above the MA200, signaling a sustained uptrend. Additionally, the Wave Oscillator portrays bullish momentum, further corroborating the favorable outlook for BTCUSD.

Elliott Wave Analysis TradingLounge 4Hr Chart, 11 March 24,
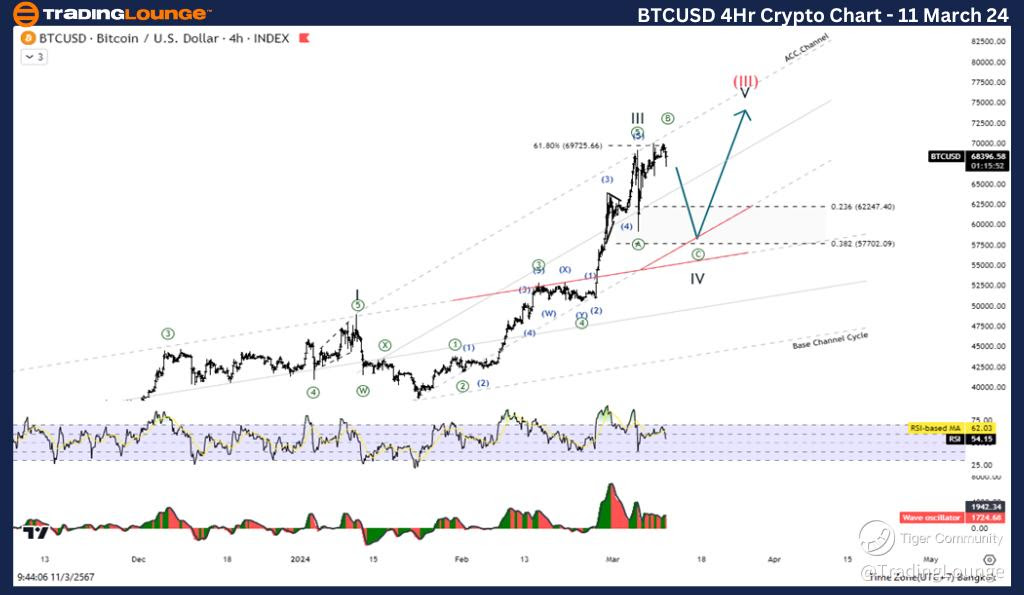
Bitcoin/ U.S. dollar(BTCUSD) 4-Hour Chart Analysis
Bitcoin/ U.S. dollar(BTCUSD) Elliott Wave Technical Analysis
Elliott Wave Analysis: BTCUSD 4-Hour Chart
Function: Follow Trend
Mode: Motive
Structure: Impulse
Position: Wave III
Direction Next higher Degrees: Wave (III)
Wave Cancel invalid level: 31046.25
Bitcoin/ U.S. dollar(BTCUSD) Technical Analysis Overview: Similar to the daily chart analysis, the 4-hour chart underscores the completion of a five-wave increase in Wave (III). Traders should remain cautious of potential corrective movements looming on the horizon.
Bitcoin/ U.S. dollar(BTCUSD) Trading Strategy: The bullish momentum persists on the 4-hour timeframe, mirroring the upward trend observed in the daily chart. Brace for a potential breach of the all-time high, but exercise prudence as the market approaches a critical juncture. Expect two additional waves to finalize the Impulse structure, while staying vigilant for corrective actions.
Bitcoin/ U.S. dollar(BTCUSD) Technical Indicators: Consistent with the daily chart, the MA200 remains a crucial indicator, suggesting a continued uptrend. Furthermore, the Wave Oscillator reaffirms bullish momentum, providing additional confidence in the positive outlook for BTCUSD trading.
Conclusion: Elliott Wave Analysis serves as a formidable ally for traders navigating the volatile waters of cryptocurrency markets. By dissecting wave structures, identifying key levels, and leveraging technical indicators, traders can gain valuable insights into market trends and formulate effective trading strategies. As BTCUSD continues its upward trajectory, diligent analysis and prudent risk management will be paramount for achieving success in cryptocurrency trading.
Technical Analyst: Kittiampon Somboonsod, CEWA
Source: visit Tradinglounge.com and learn From the Experts Join TradingLounge Here
See Previous: Uniswap/U.S. dollar (UNIUSD)
TradingLounge Once Off SPECIAL DEAL: Here > 1 month Get 3 months.
