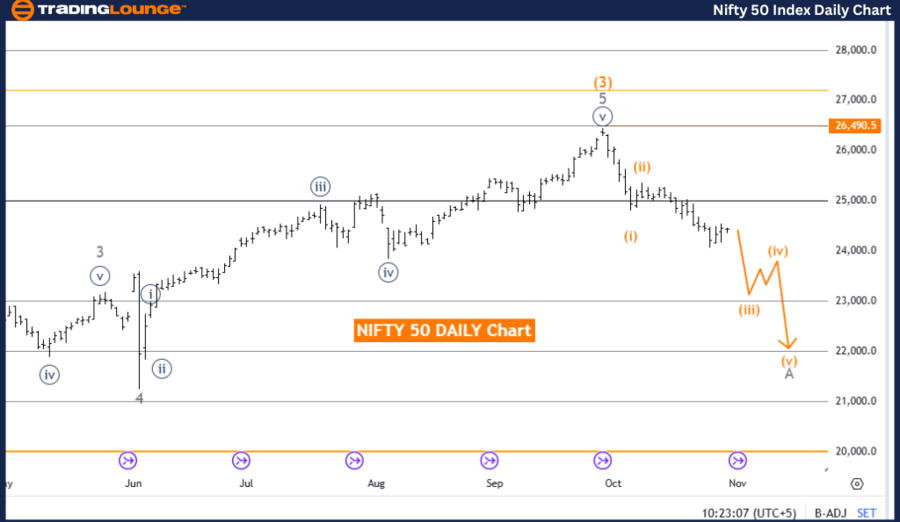
NIFTY 50 (India) Elliott Wave Analysis – Trading Lounge Daily Chart
NIFTY 50 (India) Elliott Wave Technical Analysis
-
Function: Counter Trend
-
Mode: Impulsive as A
-
Structure: Gray Wave A
-
Position: Orange Wave 4
-
Direction for Next Higher Degrees: Gray Wave B
-
Details: Orange wave 3 appears complete. Currently, A of orange wave 4 is active.
- Wave Cancellation Level: 26490.5
The daily Elliott Wave analysis for NIFTY 50 (India) indicates an impulsive A wave developing within a broader corrective framework in orange wave 4. Following the completion of orange wave 3, which contributed to the previous uptrend, the index has entered a correction. Currently, gray wave A in orange wave 4 is active, suggesting a temporary consolidation phase that may lead to renewed bullish momentum.
Gray wave A within orange wave 4 represents the initial stage of this correction, with market forces consolidating after recent gains. Post-gray wave A, the analysis projects gray wave B at the next higher degree, advancing the ongoing correction. This structure often appears in corrective phases, offering the market an opportunity to stabilize and gain a stronger foundation for future upward movements.
A critical component of this analysis is the wave cancellation level set at 26490.5. This level acts as essential support, maintaining the current wave structure. If the index drops below this level, the present wave count will be invalidated, prompting a revised trend analysis. Holding above 26490.5 is crucial to confirming the ongoing corrective structure and maintaining the integrity of orange wave 4.
Summary:
The NIFTY 50 daily outlook signals an impulsive counter-trend within orange wave 4, with gray wave A actively in play. The market is experiencing a correction after orange wave 3, with 26490.5 serving as a support level. Provided this level holds, the structure remains intact, allowing a possible transition into gray wave B. This setup provides insight into anticipated short-term corrections and the broader trend's continuation.
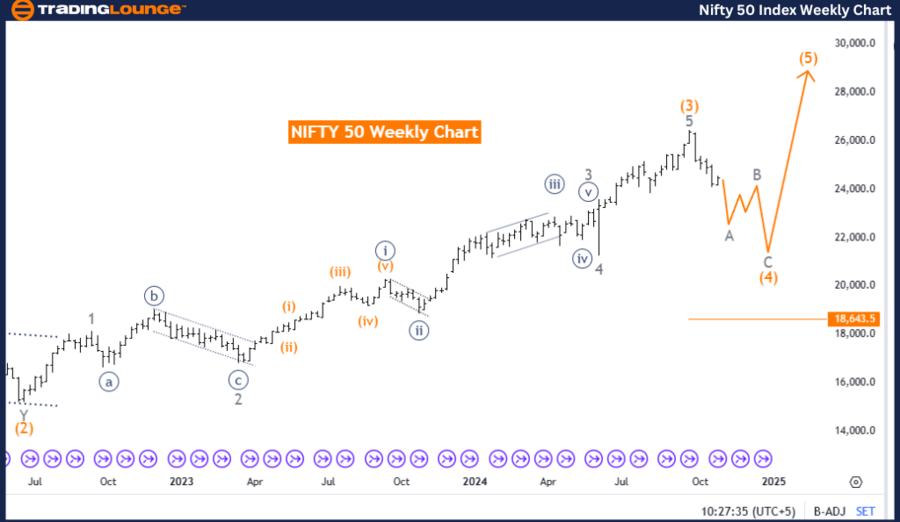
NIFTY 50 (India) Elliott Wave Analysis – Trading Lounge Weekly Chart
NIFTY 50 (India) Elliott Wave Technical Analysis
-
Function: Counter Trend
-
Mode: Corrective
-
Structure: Likely Zigzag
-
Position: Orange Wave 4
-
Direction for Next Higher Degrees: Orange Wave 5
-
Details: Orange wave 3 appears complete. Currently, orange wave 4 is active.
- Wave Cancellation Level: 18643.5
In the weekly Elliott Wave analysis, NIFTY 50 shows a corrective movement through orange wave 4, indicating a pause in the broader bullish trend. Following the completion of orange wave 3, which contributed to prior upward movement, orange wave 4 currently unfolds in a likely zigzag structure. This typical three-part corrective movement allows the index to stabilize before advancing into the next bullish phase.
Orange wave 4 indicates a temporary retracement, marking a pause in upward momentum as the market consolidates. Upon the completion of orange wave 4, expectations shift toward orange wave 5, indicating a potential return to bullish action. This corrective wave aligns with Elliott Wave theory’s concept of alternating between advances and consolidations.
A vital element of this analysis is the wave cancellation level at 18643.5. This support level is critical to preserving the current wave pattern. If the index falls below this point, the wave count requires reassessment. Stability above 18643.5 is essential for validating this corrective phase and supporting the transition into wave 5.
Summary:
The weekly NIFTY 50 outlook suggests an ongoing corrective phase in orange wave 4 within an overarching bullish structure. The 18643.5 support level is crucial to sustaining this wave pattern, with stability above it favoring a continuation through wave 5. This phase provides insight into the anticipated path, positioning the index for a renewed bullish trend after completing the current correction.
Technical Analyst: Malik Awais
Source: visit Tradinglounge.com and learn From the Experts Join TradingLounge Here
Previous: Nikkei 225 Elliott Wave Technical Analysis
VALUE Offer - Buy 1 Month & Get 3 Months!Click here
Access 7 Analysts Over 200 Markets Covered. Chat Room With Support