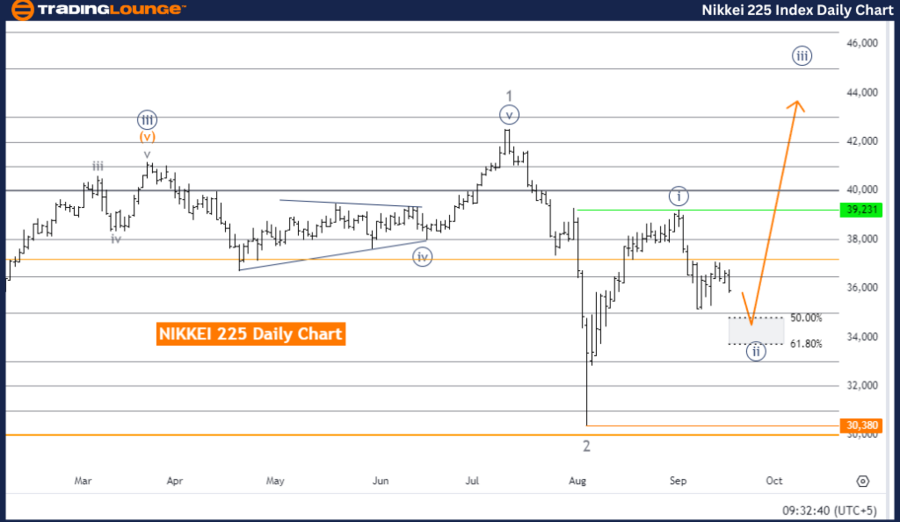
NIKKEI 225 Index Elliott Wave Analysis Day Chart
NIKKEI 225 Index Day Chart Analysis
N225 Elliott Wave Technical Analysis
-
Function: Counter Trend
-
Mode: Corrective
-
Structure: Navy Blue Wave 2
-
Position: Gray wave 3
-
Direction Next Higher Degrees: Navy blue wave 3
-
Details: Navy Blue Wave 1 has been completed, and Navy Blue Wave 2 is currently developing.
- Wave Cancel Invalid Level: 30,380
The Elliott Wave analysis for Nikkei 225 on the day chart highlights a corrective counter-trend phase. The market is presently in Navy Blue Wave 2, which forms part of a broader correction following the conclusion of Navy Blue Wave 1. This indicates that the initial impulsive wave has finished, and the market has entered a retracement phase.
Elliott Wave theory proposes that following the completion of wave 1, a corrective phase (wave 2) typically ensues. This retracement is a temporary pause within the market's larger trend, suggesting that the market is consolidating before resuming its earlier momentum.
Navy Blue Wave 2 is moving against the direction of the prior Navy Blue Wave 1 impulse. Once this corrective wave concludes, the market is expected to transition into navy blue wave 3, which is usually the most powerful and extended wave in the Elliott Wave cycle. This suggests a significant potential shift in the market once the corrective phase ends.
The wave cancel invalid level of 30,380 acts as a key threshold; if the market moves above this level, the current wave count will be invalidated, requiring a reassessment. However, as long as the price stays below this point, the counter-trend correction is likely to continue.
Conclusion: Nikkei 225 is undergoing a corrective phase in navy blue wave 2 following the completion of navy blue wave 1. The market is expected to stay in this phase unless the price breaks the invalidation level of 30,380.
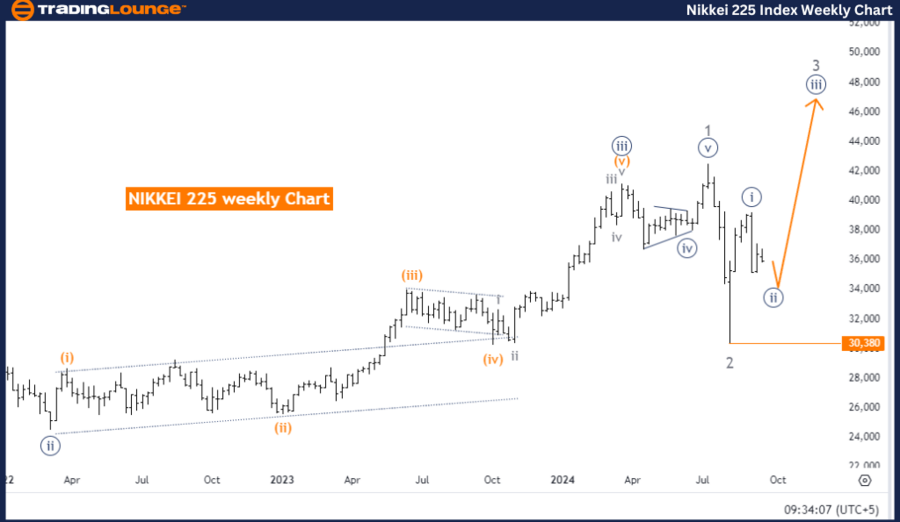
NIKKEI 225 (N225) Elliott Wave Analysis Weekly Chart
NIKKEI 225 (N225) Elliott Wave Technical Analysis
-
Function: Counter Trend
-
Mode: Corrective
-
Structure: Navy Blue Wave 2
-
Position: Gray wave 3
-
Direction Next Higher Degrees: Navy blue wave 3
-
Details: Navy blue wave 1 has been completed, and navy blue wave 2 is unfolding.
- Wave Cancel Invalid Level: 30,380
The Elliott Wave analysis on the weekly chart for Nikkei 225 reveals that the market is in a corrective counter-trend phase, specifically within navy blue wave 2. This phase follows the completion of navy blue wave 1, which was an impulsive movement. Now, the market is retracing some of the prior gains within navy blue wave 2.
Elliott Wave theory states that after a strong impulse wave, a correction typically follows, providing the market a chance to consolidate before continuing its larger trend. Navy blue wave 2 serves as this corrective movement against the dominant trend initiated by navy blue wave 1.
Navy blue wave 2 represents a pullback, suggesting a period of consolidation before the market resumes its upward trajectory in navy blue wave 3. According to Elliott Wave principles, wave 3 is often the most powerful, indicating that after the completion of wave 2, a strong bullish movement may follow.
The wave cancel invalid level of 30,380 serves as a critical benchmark. Should the market exceed this level, the current wave count would be void, requiring a fresh analysis of the wave structure. However, as long as the market remains under this threshold, the corrective phase is expected to persist.
Summary: Nikkei 225 is currently in navy blue wave 2, a corrective counter-trend phase, following the conclusion of navy blue wave 1. The market is projected to resume its upward movement with navy blue wave 3 after the correction ends, as long as the price remains below the invalidation level of 30,380.
Technical Analyst: Malik Awais
Source: visit Tradinglounge.com and learn From the Experts Join TradingLounge Here
Previous: S&P/ASX 200 index Elliott Wave Technical Analysis
Special Trial Offer - 0.76 Cents a Day for 3 Months! Click here
Access 7 Analysts Over 200 Markets Covered. Chat Room With Support