ADAUSD Elliott Wave Analysis - TradingLounge Daily Chart

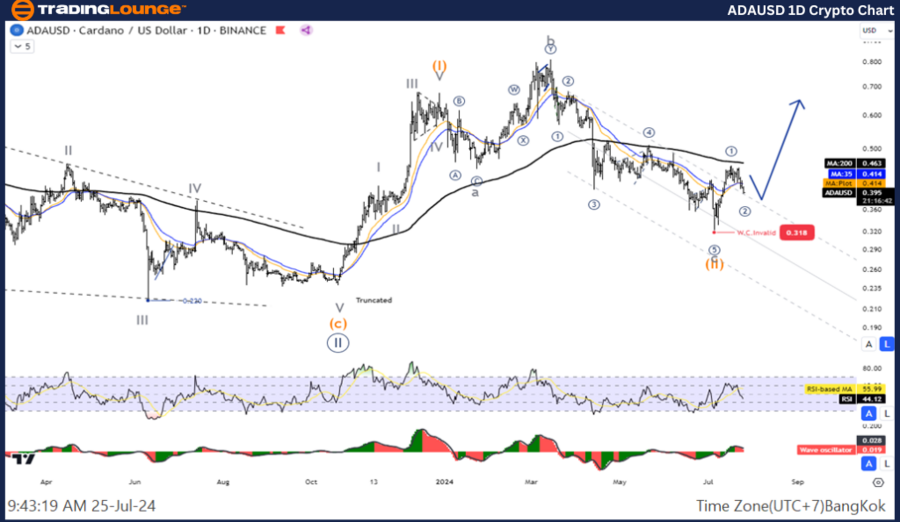
Cardano / U.S. Dollar (ADAUSD) Daily Chart Analysis

ADAUSD Elliott Wave Technical Analysis

Function: Follow Trend

Mode: Motive

Structure: Impulse

Position: Wave ((1))

Direction Next Higher Degrees: Wave I of Impulse

Wave Cancel Invalid Level: Not specified

Details: The chart shows a five-wave increase in Wave ((1)).

Cardano / U.S. Dollar (ADAUSD) Trading Strategy

The outlook for Cardano suggests the Wave 1 rally is nearing its end. The price is expected to enter a correction phase in Wave 2, likely testing the 61.8% (0.365) retracement level of Wave 1 before resuming the upward trend in Wave 3. It's advisable to wait for the correction to conclude before re-entering the trend.

Cardano / U.S. Dollar (ADAUSD) Technical Indicators

The price remains below the MA200, indicating a downtrend, while the Wave Oscillator signals bullish momentum.

ADAUSD-1D-Crypto-Cha...


ADAUSD Elliott Wave Analysis - TradingLounge H4 Chart

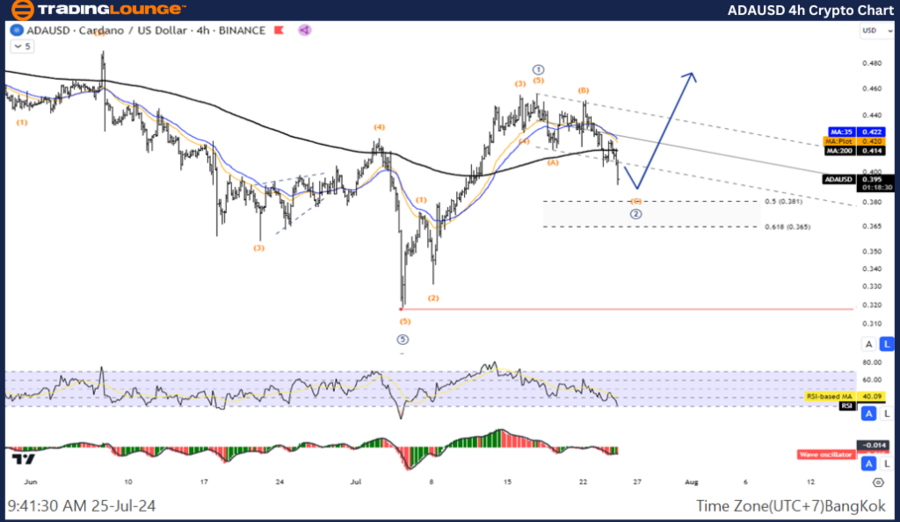
Cardano / U.S. Dollar (ADAUSD) 4-Hour Chart Analysis

ADAUSD Elliott Wave Technical Analysis

Function: Follow Trend

Mode: Motive

Structure: Impulse

Position: Wave ((1))

Direction Next Higher Degrees: Wave I of Impulse

Wave Cancel Invalid Level: Not specified

Details: The rally in Wave 1 is approaching completion, indicating a potential correction in Wave 2.

Cardano / U.S. Dollar (ADAUSD) Trading Strategy

The outlook for Cardano indicates that the Wave 1 rally may be ending. The price is expected to correct in Wave 2, likely testing the 61.8% (0.365) retracement level of Wave 1 before potentially rising again in Wave 3. Investors should consider waiting for the correction to end for a better entry point.

Cardano / U.S. Dollar (ADAUSD) Technical Indicators

The price remains below the MA200, suggesting a downtrend, with the Wave Oscillator indicating bearish momentum.

Technical Analyst:  Kittiampon Somboonsod

Source: visit Tradinglounge.com and learn From the Experts Join TradingLounge Here 

See Previous: NEO / U.S. Dollar (NEOUSD) Elliott Wave Technical Analysis

Special Trial Offer - 0.76 Cents a Day for 3 Months! Click here

Access 7 Analysts Over 170 Markets Covered. Chat Room With Support

ADAUSD-4h-Crypto-Cha...

Related

QUALCOMM Inc. (QCOM) Stocks Elliott Wave Technical Analysis: Monitor Key Levels to identify Potential Entry and Exit Points

QUALCOMM Inc. (QCOM) Stocks Elliott Wave Technical Analysis: Monitor Key Levels to identify Potential Entry and Exit Points

This QCOM Elliott Wave analysis provides traders with insights into QUALCOMM's stock forecast, p...

Read More >
Eli Lilly & Co. (LLY) Elliott Wave Technical Analysis: Focusing on Stock Forecasts, Technical Chart Patterns, and Trading Strategies

Eli Lilly & Co. (LLY) Elliott Wave Technical Analysis: Focusing on Stock Forecasts, Technical Chart Patterns, and Trading Strategies

This article offers a detailed Elliott Wave analysis of Eli Lilly & Co. (LLY), focusing on stock for...

Read More >
Cocoa Elliott Wave Analysis: Price Forecast, Fibonacci Support, and Bullish Wave 3 Setup for 2024 Trading Strategy

Cocoa Elliott Wave Analysis: Price Forecast, Fibonacci Support, and Bullish Wave 3 Setup for 2024 Trading Strategy

Cocoa is currently pulling back from its all-time high, but the bullish Elliott Wave structure remai...

Read More >
Elliott Wave Analysis on ASX Stock RIO Tinto (RIO) Provides Investors with a Detailed Look at Current Trends and Trading Strategies

Elliott Wave Analysis on ASX Stock RIO Tinto (RIO) Provides Investors with a Detailed Look at Current Trends and Trading Strategies

Our comprehensive Elliott Wave analysis on ASX: RIO Tinto (RIO) provides investors with a detailed l...

Read More >
Market dynamics: Microsoft Inc.(MSFT) Elliott Wave Technical Analysis Insights

Market dynamics: Microsoft Inc.(MSFT) Elliott Wave Technical Analysis Insights

Our Elliott Wave analysis of Microsoft Inc. (MSFT), reveals a counter-trend sentiment with correctiv...

Read More >
AXIS BANK LTD. Elliott Wave Analysis: Share Price Forecast, Technical Trends, and Key Support & Resistance Levels

AXIS BANK LTD. Elliott Wave Analysis: Share Price Forecast, Technical Trends, and Key Support & Resistance Levels

AXIS BANK stock analysis using Elliott Wave theory. This article covers share price forecasts, techn...

Read More >

$1 for 2 Weeks

then $29 a month!

What a Special Offer!

Trade Recommendations

Unleash the power of deversified trading with our comprehensive portfolio, covering 250+ markets:

  • Stock Trades
  • Crypto Trades
  • Forex Trades
  • Commodity Trades
Elliott Wave Analysis

Gain a competitive edge with expert insights and AI-powered Elliott Wave charting into:

  • Global Indices
  • US Stocks & ASX Stocks
  • Forex & Crypto
  • Commodities
Top-Notch Trading Tools

Equip yourself with the tools of success:

  • Real-time Chat rooms
  • Elliott Wave Algorithm
  • Portfolio tools
  • TradingLevels
  • Screener
  • Trading Game
7 Elliott Wave Analysts

Stay ahead of the market with daily charts and insightful videos
Your secret to strategic trading!

JOIN HERE


Welcome to TradingLounge (ASIC A.R.No. 321187), specialists in trades, trading education and technical analysis, covering stocks, indices, commodities, forex and cryptocurrencies.

When you join TradingLounge you have access to everything we offer, including trade tools, educational content and a social platform to chat with like-minded investors.

Read more

@Copyright 2024 by tradinglounge.com

Contact Us

Australian no: 02 4787 6020

International no: +61 (2) 47876020

Pay with:

Find us on